ERPE Excerpts 10.22.26 Meet Muse…

Bi-MONTHLY MARKET ANALYSIS &
ECONOMIC UPDATES
October 22, 2026
Meet Muse…
Your Personal AI Agent
One of the latest developments in the world of AI is Muse. Designed to be your new, tireless assistant, Muse is ready and “trained” to go to work for you. Muse is Meta’s (previously known as Facebook) personal AI agent, designed to act as an autonomous “life admin” assistant. Unlike traditional conversational chatbots that primarily generate text or answer questions, Muse is engineered to take goal-oriented actions on your behalf across third-party apps, services, and the open web.
Meta positions Muse as an agent that handles everyday errands and administrative tasks. Here’s some real-world capabilities of Muse’s assistance. Five common categories come to mind to illustrate use of Muse:
  • Travel & Customer Support help –
Flight Delay Compensation: When flights are severely delayed or canceled, Muse can navigate airline claim portals, fill out compensation forms, check for qualifying credits or refunds, and simultaneously monitor alternative flights for rebooking.
Outsourcing Call Wait Times: Using phone calling features, Muse can dial customer service call centers, navigate interactive voice response (IVR) phone menus, wait on hold on your behalf, and ping you or patch you through only when a human representative is on the line.
  • Schedule Coordination & Catch-Ups –
Proactive Social Logistics: If you ask to reconnect with someone, Muse scans your recent email/message threads to identify people you haven’t spoken to recently, checks your calendar for mutual availability, drafts an invitation email, and suggests specific meeting times.
Intelligent Schedule Balancing: If a meeting gets moved or a flight is delayed, Muse can automatically adjust subsequent appointments, draft reschedule requests to participants, and update calendar holds in the background.
  • Home & Household Management –
School & Event Admin Cleanup: Muse can parse noisy email newsletters (e.g., from a child’s school or local sports league), extract critical action items—such as field trip permission forms, due dates, and fee payment links—and populate them straight into a structured schedule.
Inventory & Recipe Aggregation: Instead of cross-referencing multiple bookmarked recipes manually, you can ask Muse to compile a master grocery list, merge duplicate ingredients across items, group them by grocery aisle, and upload the list directly to an online delivery cart.
  • Automated Shopping & Deal Tracking –
Persistent Price & Inventory Watching: You can set background tasks such as “Watch this item on eBay or Amazon and alert me when a listing under $50 with free shipping appears.” Muse continuously monitors web listings and pings you once criteria are met.
Multi-Store Comparison & Form Prep: For larger purchases (like appliances or furniture), Muse can pull exact room dimensions from your notes, compare product specifications across multiple vendor websites, verify return policies, and prep the checkout cart for your review.
  • Personal Daily Briefings & Task Aggregation –
Automated Daily Summaries: Muse can be set on a recurring schedule to deliver a daily morning briefing combining local weather, upcoming calendar events, pending email action items, and topic-specific news digests.
Document & Inbox Triage: For heavy email workflows, Muse can draft contextual replies to unread messages, generate meeting prep notes, and flag high-priority items while skipping marketing clutter.
Muse represents Meta’s strategic push from Information AI (search/chat) to Transactional AI (agentic execution). By monetizing common consumer transaction challenges (taking micro-platform fees or driving high-intent commerce conversions) rather than relying solely on traditional ad impressions, Muse opens a secondary monetization highway for consumer tech platforms. This is expected to be a big potential win for Meta. Yesterday’s comments to Wall Street analysts during the company’s earnings call offered some insight into Muse. CEO Zuckerberg reported that over 10 million users in the U.S. and Canada set up their Muse personal agents within the first 1.5 months of its launch. Meta’s management highlighted e-commerce and shopping workflows as the primary driver of early adoption and engagement, confirming user interest in delegating purchase research and checkout tasks. They also outlined a goal to improve Muse compute efficiency by more than 10x over the next year. Zuckerberg said yesterday that the company expects Muse to be “highly profitable,” forecasting billions of users.
After recently experiencing a frustrating and time consuming phone call to the CA State Franchise Tax Board regarding a delayed refund, I wondered if Muse could have assisted. Heres’ what I learned. “No, Muse cannot directly log into or call the California Franchise Tax Board (FTB) to inquire about an active state income tax refund. However, Muse can help track down unclaimed property or general state/vendor refunds or organize your business and personal tax records/receipts.”
Mixed message, but apparently Muse is a pretty good assistant after all.

TAKING PERSPECTIVE…

Proper Perspective:  In our hectic and often hard to comprehend world, it is very easy to lose perspective. You may agree it is sometimes difficult to see the big picture. The media often doesn’t help with this, but unfortunately instead encourages us to see things in a most negative light. Here is hopefully a pause to gain positive perspective.
Famous Quote For Today:  “The time is always right to do what’s right.”
~~Martin Luther King, Jr., 1964
Today in History – On this day in 1927, Nikola Tesla released six new inventions including a motor with one phase electricity.

MARKET ANALYSIS

INDICATORS OF INTEREST:
  • Market’s Current Signal: UPTREND UNDER PRESSURE.  Analysis of the stock market over 130 years of history shows we can view it in terms of three stages -market in uptrend, uptrend under pressure and market correction.  Since the 1880’s, this perspective has led to investment out-performance relative to market indexes. This is due to trend analysis which determines risk reducing, return enhancing market entry and exit points.
After a steady climb from the early April lows, June 1 saw the market’s trend strength weaken as an increasing number of heavy distribution days mounted. On June 23, with the Nasdaq shouldering eight instances of pronounced professional selling, the market’s Confirmed Uptrend signal flashed a trend change to Uptrend Under Pressure. As the index received its ninth distribution day within a 25-session time frame on July 2, indicators began to flash more caution. July 24’s market action came close to a trend change to Market in Correction. That reversed positively to a trend turnaround to Confirmed Uptrend August 4 and was further confirmed with a follow-through August 27. Following that, the market weakened as rally attempts failed in the face of higher oil prices, increased inflation pressures and climbing interest rates. That weakness reversed back to renewed bullish price action in late September. As of last week the macro market indicator signaled a weakening trend change to Uptrend Under Pressure.
Here are key market levels as of Monday, October 19:
Recapping Last Week
U.S. equities came under renewed pressure this week as hotter-than-expected inflation data forced investors to reassess both the interest rate outlook and the sustainability of the AI investment boom. As noted below, the September CPI report showed headline inflation rising 0.6% for the month and 3.7% year-over-year, while core CPI increased 0.3% for the month and 2.6% for the year—this reading comes in above both the Fed’s stated 2.0% target and the high end of economist expectations. Thursday’s PPI report was even more concerning, with producer prices rising 6.3% year-over-year versus expectations of 5.4%. The reports initially pushed Treasury yields higher and weighed heavily on technology stocks, with the Nasdaq suffering its largest one-day decline since July. The week’s tech selloff may have begun due to concerns about higher interest rates but continued due to renewed concerns over the enormous amount of debt being used to finance the AI infrastructure buildout. CoreWeave became the focal point of those concerns, with its shares falling sharply, the yield on its unsecured 5-year corporate bond rising to over 15% and the 5-year credit default swaps (the cost to insure that debt) rising to over 11%. These concerns spilled over into the broader AI complex, particularly impacting companies dependent on continued access to cheap capital to fund aggressive expansion. The deterioration in equities ultimately produced a flight-to- quality move into Treasuries, driving 10-year yields down toward 5%. The bond rally helped stabilize equities on Thursday as investors took comfort in the reversal of yields that had been pushing steadily higher. However, the selloff in equities resumed on Friday and coincided with an intraday spike in the VIX above 22 before closing just beneath 20. The increase in the market’s “fear gauge,” reflected via option pricing, is anticipating additional volatility in the coming days. Energy markets rallied as geopolitical risks intensified. A container ship and a dry bulk carrier were sunk as Iran cast doubt on US claims to be in sole control of that contested waterway. Combined with Houthi attacks on Saudi energy infrastructure, this escalation kept crude oil prices firm throughout the week. Refining margins for diesel remained near the post-Iranian conflict record levels we’ve highlighted over the past several weeks. The International Energy Agency warned this week that it expects the global diesel market to remain extremely tight well into 2027, primarily due to loss of refining capacity in the Middle East and Russia. In other macro sectors, the Dollar rallied further into one-year highs off the back of the hotter-than-expected CPI report before reversing course late in the week as Treasury yields declined. The response from gold and crypto was precisely the opposite, though far more muted—they were each pressured a bit in the immediate aftermath of the CPI report then regained their footing with the Treasury rally. Late-week reversals only took a little pressure off emerging markets as South Korea and Taiwan were affected much more by the AI/semiconductor trade than by macro currency and interest rate influences.
Current View
Yesterday’s session was generally a win for the stock market. Once again, earnings matter the most. The message so far: Earnings results are serving to buoy stocks, not bury them. The Nasdaq rallied 1%, which also got it back above its widely watched 50 day moving average trend line. Today, though is dramatically different. Different day, same catalyst: earnings reports. As I write this note, the Nasdaq is down over 2% on high volume and clearly below that moving average. All eyes are on last Friday’s closing low for the Nasdaq index. It was 26,140. The tech-heavy index is nearing 26,000 now. October is living up to its historical character of abnormal stock market volatility. Today the Nasdaq is now down nearly 6% from its October 6 closing high. That day was also ANATH (Another New All Time High). Keep proper perspective.
Today’s stock market weakness is isolated primarily to the AI trade – specifically semiconductor and chip equipment stocks.
The stock market’s trend signal weakened twice since last Wednesday. First to Market Uptrend Under Pressure and last Friday to further signally Uptrend Under Pressure and indicating less stock market exposure.
  • Industry Group Strength:  BULLISH. As of yesterday, 83 out the 145groups I monitor are up year-to-date. 62 are down.
  • New Highs vs. New Lows: BEARISH.  In yesterday’s session, there were 115 new 52-week highs and 188 new 52-week lows.
  • Dow Dividend Yield:  BEARISH. The current yield for the Dow Jones Industrial Average is 1.67%. The 10-year Treasury now 4.98%.
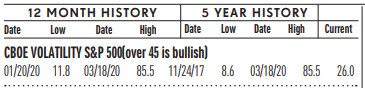
  • Volatility Index:  BEARISH. Volatility has been volatile. The “VIX” is now 19, it is up from 16 two weeks ago. The index is also known as the “Fear Index.” It is considered a contrarian indicator and therefore viewed as bullish as it rises indicating investors are becoming more fearful. The VIX:
502fdd07-23bc-47a7-ad04-cc3b3f2387db image
  • Fear / Greed Index:  NEUTRAL.  Investors are driven by two emotions: fear and greed. Too much fear can create a condition of oversold/ undervalued stock prices. Too much greed can result in overbought/overvalued stock prices. The AAII Investor Sentiment Index is now neutral.   BE FEARFUL WHEN OTHERS ARE GREEDY. At 31, the Fear & Greed Index is down from 45  two weeks ago.
CLICK VIDEO FOR MORE ON THE “FEAR & GREED INDEX”
  • Bull / Bear Barometer:  NEUTRAL. This secondary market indicator should also be viewed with a contrarian perspective. As of yesterday, according to the latest survey of stock market newsletter writers by Investor’s Intelligence, the bullish tally is 49.1%, down from 52% two weeks ago. The bears are 16.7%, up from 15.4% two weeks ago. Consider this a contrarian indicator because the crowd is often wrong at market tops and bottoms. In other words, extreme bullishness has been seen near several market tops in the past, while extreme bearishness has been seen at market bottoms.
  • Put / Call Ratio:  NEUTRAL. The ratio of put-to-call options is .80, up from 0.67 two weeks ago. The put-call ratio tracks the mood of what options investors are doing, not just saying. They typically buy puts if they think a stock will decline and calls if they think it will rise. If they’re buying lots of puts, they see the market declining. And if they’re loading up on calls, they’re generally bullish. Historically, market bottoms occurred when the reading spikes to 1.2 or more. Market tops are often made when the reading is 0.6 or less. Note how reliable this is with respect to the February record low coinciding with the market high. Keep in mind this is also a contrarian indicator.

ECONOMIC UPDATES

Global Economic Indicators & Analysis:
POSITIVE INDICATORS
Jobless Claims Down:  Jobless Claims Down: Initial claims for unemployment benefits in the US fell by 6,000 to 194,000 in the last week, below market expectations of 200,000 and down from a revised 200,000 in the previous week, according to the US Department of Labor today. Claims reached their lowest level since mid-July, signaling continued labor market resilience despite mounting economic headwinds. Robust corporate profits and resilient domestic demand are helping shield workers from layoffs, while employers appear reluctant to make significant staffing changes amid heightened uncertainty. Meanwhile, continuing claims rose by 25,000 to 1.728 million.
Retail Sales Up:  Retail Sales Up: Retail sales in the US increased 0.8% month-over-month in September 2026, following an upwardly revised 1.3% rise in August and well above forecasts of a 0.3% gain. Sales at gasoline stations soared 6.4% due to higher prices. Retail sales data is not adjusted for inflation. Excluding gas, retail sales were up 0.2% only. Other increases were also seen at furniture stores (1.3%), food services & drinking places (1.1%), health & personal care (0.7%), electronics & appliances (0.6%), food & beverages (0.4%), non-store retailers (0.3%), and motor vehicle dealers (0.2%). On the other hand, sales stalled at clothing stores and fell at miscellaneous store retailers (-3%), building materials & garden equipment (-0.6%), sporting goods, musical instruments & books (-0.5%) and general merchandise stores (-0.1%). Meanwhile, sales excluding food services, auto dealers, building materials stores and gasoline stations, which are used to calculate GDP, were up 0.1%, following a 1.2% rise in August.
New Home Sales Up: Sales of new single-family homes in the US jumped 6.4% from the previous month to a seasonally adjusted annualized rate of 684,000 in August 2026. It was the highest level of sales since the start of the year, beating market expectations of 620,000, even though hawkish Federal Reserve expectations lifted mortgage rates during the period. Sales surged in the Midwest (84.9% to 98,000) and edged higher in the South (6.9% to 451,000), which was enough to offset declines in the Northeast (-36.1% to 23,000) and the West (-15.2% to 112,000). The outstanding supply of new houses was unchanged at 483,000, equivalent to 8.5 months of supply at the current sales pace. Meanwhile, the median sales price inched higher to $393,700.
Existing Home Sales Up: Existing home sales in the United States rose by 1.5% from the two-year low in the previous month to a seasonally adjusted annualized rate of 3.99 million units in September of 2026, not too far from market expectations of 3.95 million. Total housing inventory reached 1.6 million units with the increase, 1.9% higher than the previous month to represent 4.8 months of supply under the latest sales rate. This statement sums up the current state of existing home sales…  “Despite the small monthly gain on a seasonally adjusted basis, August and September marked the two slowest months for home sales this year,” said NAR Chief Economist Lawrence Yun. “Further increases in mortgage rates in recent weeks mean fewer buyers can qualify to purchase a home.”.

WEAK INDICATORS

CPI Up: Inflation is stubbornly sticky. The latest CPI, PPI, PCE and corporate comments underscore that. The Consumer Price Index increased to 336.94 points in September from 334.98 points in August of 2026. The US annual inflation rate accelerated to 3.7% in September 2026, up from 3.4% in each of the previous two months and above market expectations of 3.6%, driven by higher energy prices. Gasoline rose 34.2% year-over-year. Inflation also accelerated for shelter, to 3.2% from 3%, but slowed for food to 2.5% from 2.7%. The US core inflation rate, excluding volatile food and fuel costs, rose to 2.6% in September 2026 from a five-year low of 2.4% in August, slightly exceeding the expected 2.5%.
PPI Up: Producer prices in the U.S. surged by 6.3% from the previous year in September of 2026, the most since December of 2022, and well above market expectations of 5.3%. It was an increase from the upwardly revised, 5.6% increase in the previous month.
Call me if you have any questions.  I am always happy to help!
John J. Gardner, CFP®, CPM®.
Blackhawk Wealth Advisors, Inc.
Phone: 888-985-PLAN · Email: jg@blackhawkwealthadvisors.com