ERPE Excerpts 9.24.26 September/October “Autumn Anomaly”

Bi-MONTHLY MARKET ANALYSIS &

ECONOMIC UPDATES

September 24, 2026

The “Autumn Anomaly”

 Unpacking the September Effect and October’s Volatile Trap

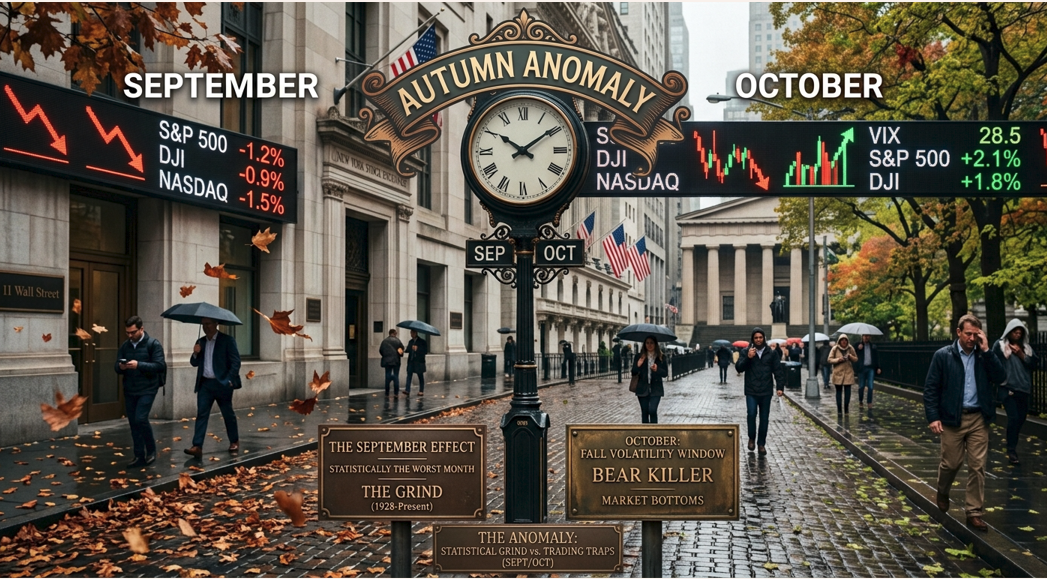
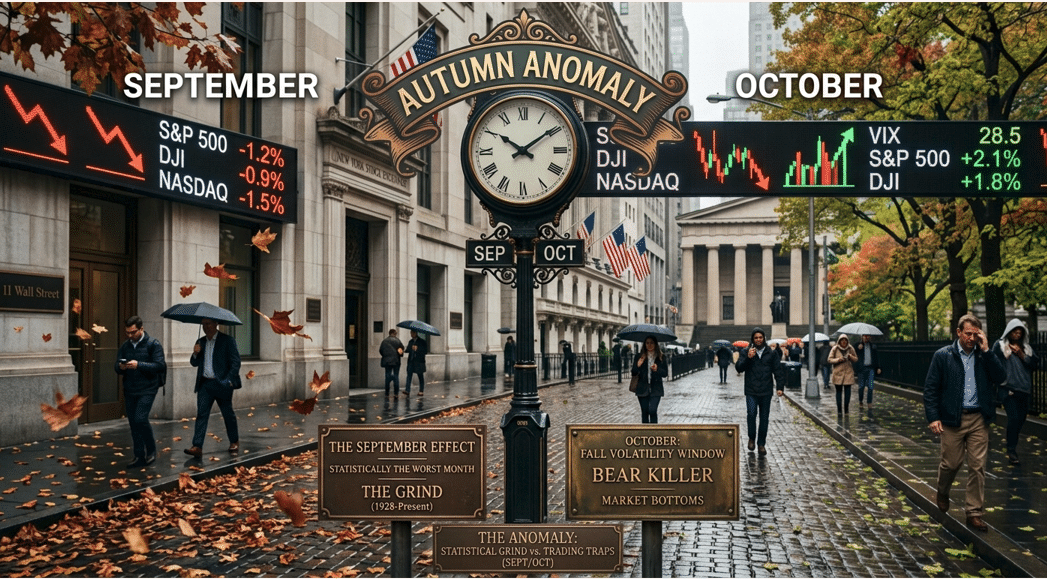
As summer fades and trading desks return to full strength, financial media and market participants routinely shift their attention toward the calendar. September and October carry a legendary reputation on Wall Street. Together, this period is often referred to as the Autumn Anomaly or the Fall Volatility Window—the infamous setup for the old adage, “Sell in May and go away,” which concludes as investors prepare to re-enter ahead of the year-end Q4 rally. I have referred to that saying for decades. However, treating September and October as a single risk period misses a crucial distinction. Historically, these two months exhibit fundamentally different personalities: September is a steady, statistical grind down, while October is a high-volatility “bear killer” that terrifies investors before frequently establishing major market bottoms. Here’s more on both months…

The September Effect — The Statistical Grind

Unlike single historical crises that hit out of nowhere, the “September Effect” is a persistent, structural drag observed across nearly a century of market history. The Long-Term Record: Since 1928, the S&P 500 has averaged a loss of approximately 1.0% in September, making it statistically the worst-performing month of the year and the only month with a consistently negative average over long-term multi-decade horizons. Historically, stocks finish September in positive territory less than 45% of the time. Two established catalysts contribute to this historical stock market behavior. One, as Wall Street returns from summer breaks, trading volume surges. Institutional managers actively clean house, shedding underperforming assets accumulated earlier in the year. Secondly, mutual funds take unique action typically during this period. A significant portion of mutual funds end their fiscal year on October 31. Consequently, September becomes prime territory for tax-loss harvesting and portfolio “window dressing” ahead of mandatory disclosures.

One of the most informative research tools I use is the Stock Trader’s Almanac. It’s been a useful resource since 1968 delivering historic investment insights. Here’s what the STA says about September:

◆ Portfolio managers back after Labor Day tend to clean house in September ◆ Biggest % loser on the S&P, Dow and NASDAQ since 1950 ◆ Streak of four great Dow Septembers averaging 4.2% gains ended in 1999 with six losers in a row averaging –5.9%, up four straight 2005–2007, down 6% in 2008 and 2011, up 7.7% in 2010, down big in four of last five years ◆ Day after Labor Day Dow down 13 of last 16 ◆ S&P opened strong 18 of last 30 years but tends to close weak due to end-of-quarter mutual fund portfolio restructuring, last trading day: S&P down 18 of past 28 ◆ September Triple-Witching Week can be dangerous; week after is pitiful.

The October Effect — Perception vs. Reality

If September is a slow burn, October is a flashpoint. Wall Street folklore views October with dread due to its historical association with historic market panics. Yet, the data tells a much more nuanced story.

Here’s the Stock Trader’s Almanac on October:

◆ Beware “Octoberphobia” from crashes in 1929, 1987, 554-point drop October 27, 1997, back-to-back massacres 1978 and 1979, Friday the 13th 1989 and the 2008 meltdown ◆ Yet October is a “Bear Killer” and turned the tide in 13 post-WWII bear markets: 1946, 1957, 1960, 1962, 1966, 1974, 1987, 1990, 1998, 2001, 2002, 2011, and 2022 ◆ First October Dow top in 2007 ◆ Worst six months of the year ends with October ◆ No longer worst month ◆ Best Dow, S&P and NASDAQ month from 1993 to 2007 ◆ Midterm election year Octobers since 1950, #1 Dow (+3.2), #1 S&P (+3.0%) and #2 NASDAQ (+3.2%) ◆ October is a great time to buy ◆ Big October Dow gains five years 1999–2003 after atrocious Septembers ◆ Enter Best Six Months earlier using MACD ◆ October 2022, best Dow month by points, up over 4000 (+14.0%).

Below are history’s worst bear markets and why the stock market has given October a bad name…

Major October Market Panics

Event & Period Single-Day Peak Impact Monthly/Peak-to-Trough Decline Primary Triggers & Catalysts Long-Term Outcome & Legacy
Panic of 1907(Oct 1907) N/A (Multi-day bank runs) ~15% drop in NYSE stocks in Oct (~50% total decline) Unregulated trust companies, failed copper speculation, bank runs Led directly to the creation of the Federal Reserve System in 1913 after J.P. Morgan organized private liquidity bailouts.
Wall Street Crash of 1929 (Oct 24–29, 1929) -12.8% (Oct 28 – Black Monday)-11.7% (Oct 29 – Black Tuesday) -19.7% (Dow in Oct 1929; ~89% total bear market drop) Extreme margin leverage, speculative bubble, Fed rate hikes. Triggered the Great Depression; spurred creation of the SEC and the Securities Act of 1933.
Black Monday

(Oct 19, 1987)

-22.6% (Largest single-day % drop in Dow history) -21.5% (S&P 500 in Oct 1987) Computerized portfolio insurance automated sell loops, trade deficit friction. Sparked mandatory market-wide circuit breakers to halt cascading algorithmic sell-offs.
Global Financial Crisis

(Oct 2008)

-9.0% (Oct 15, 2008) -16.8% (S&P 500 in Oct 2008; ~56.8% total peak-to-trough) Subprime mortgage collapse, Lehman Brothers failure, frozen interbank credit. Prompted unprecedented QE, zero interest rates, Dodd-Frank regulation, and bank stress testing

The “Bear Killer” Reality

Despite these historic drops, October’s reputation as a wealth-destroyer is largely a misconception driven by extreme tail-risk events. October actually finishes positive approximately 59% of the time, averaging positive gains over long horizons.

The Bear Killer: October holds the moniker of the “Bear Killer” because it has marked the ultimate bottom for many of history’s worst bear markets—including 1974, 1982, 1990, 2002, and 2022—paving the way for powerful year-end rallies.

Strategic Portfolio Takeaways

Understanding the autumn anomaly is an exercise in context, not market timing.

  • Avoid the Timing Trap: Attempting to preemptively exit the market in late August or September often backfires. Missing the sudden, sharp turnaround days that frequently occur in October can permanently damage long-term compounding.
  • Focus on Modern Catalysts: Rather than fearing calendar dates, keep your eye on concrete catalysts: Q3 corporate earnings commentary, central bank policy rate decisions, and election-cycle dynamics, all of which cluster in the fall to amplify price movement.
  • Embrace Seasonal Volatility: For disciplined, long-term investors, the autumn volatility window historically provides some of the best entry points and rebalancing opportunities of the year.

HAPPY AUTUMN!

TAKING PERSPECTIVE…

Proper Perspective:  In our hectic and often hard to comprehend world, it is very easy to lose perspective. You may agree it is sometimes difficult to see the big picture. The media often doesn’t help with this, but unfortunately instead encourages us to see things in a most negative light. Here is hopefully a pause to gain positive perspective.

MARKET ANALYSIS

INDICATORS OF INTEREST:

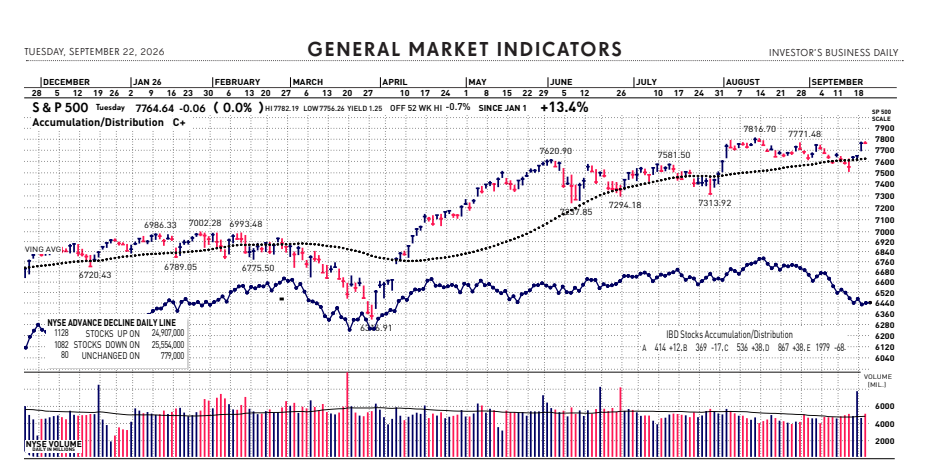
  • Market’s Current Signal: Confirmed Uptrend.  Analysis of the stock market over 130 years of history shows we can view it in terms of three stages -market in uptrend, uptrend under pressure and market correction.  Since the 1880’s, this perspective has led to investment out-performance relative to market indexes. This is due to trend analysis which determines risk reducing, return enhancing market entry and exit points.

Starting June 1 the market’s trend strength weakened as an increasing number of heavy distribution days mounted. On June 23, with the Nasdaq shouldering eight instances of pronounced professional selling, the market’s Confirmed Uptrend signal flashed a trend change to Uptrend Under Pressure. As the index received its ninth distribution day within a 25-session time frame on July 2, indicators began to flash more caution. July 24’s market action came close to a trend change to Market in Correction. That reversed positively to a trend turnaround to Confirmed Uptrend August 4 and was further confirmed with a follow-through August 27. Since then the market has weakened as rally attempts have failed in the face of higher oil prices, increased inflation pressures and climbing interest rates. After weakness triggered a signal change to Uptrend Under Pressure, renewed bullish price action in late September moved the trend signal up to Market in Confirmed Uptrend.

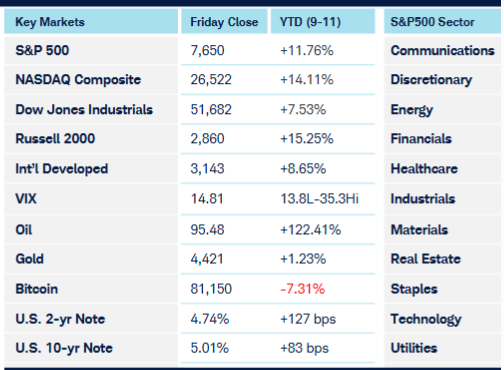
Here are key market levels as of Monday, September 21:

Recapping Last Week

Global equity markets remained remarkably resilient last week despite another sharp rise in interest rates, elevated energy prices, and the first rate hike from the Federal Reserve in more than three years. U.S. equities initially came under pressure following Wednesdays widely anticipated 25 basis point increase in the Fed Funds target rate to 3.75%-4%, but the selloff was relatively short-lived, with most major indices recovering from their knee-jerk response to the rate announcement. The S&P 500 and Nasdaq remained close to their recent highs while the Dow and Russell underperformed. The biggest focus remained on the Fed meeting and the implications of the first rate hike since 2023. While the increase itself was widely expected (Fed Funds futures were priced at a 93% probability), the Fed’s indication that another hike could come before year- end pushed shorter-term Treasury yields higher, while longer-term yields were comparatively stable. The resulting flattening of the yield curve reflected the market’s view that monetary policy will remain restrictive even as longer-term inflation expectations appear more contained. Crude oil prices finally showed some signs of easing, with Brent and WTI both pulling back as Saudi Arabia indicated that additional production could return to the market. The decline in crude, however, has not translated into lower prices for refined products, with U.S. diesel prices reaching another all- time high well above $6 per gallon. The inelastic demand from the global trucking and shipping industry, the additional seasonal demand from farmers during the fall harvest and the onset of the heating season, combined with supply disruptions primarily related to the Russian Ukrainian war have all created the perfect storm for this lifeblood of the global economy. The U.S. Dollar also responded favorably to the Fed rate hike, including adding an additional leg up against the Yen after the Bank of Japan matched the Fed’s rate hike with its own widely anticipated 25 basis point hike on Friday. Crypto markets were also notably resilient despite the Senate’s failure to advance the CLARITY Act. The legislation sought to establish a comprehensive regulatory framework for digital assets by defining and delineating responsibilities between the SEC and CFTC. Shortly after the bill failed in the Senate, the SEC issued an “Innovation Exemption” for the next five years around Tokenized Securities Venues, which provided further support for the sector. In S&P Sectors, Healthcare was the best performer while the rate-sensitive Utilities and Financial sectors were the worst. Overall, the week continued to highlight the resilience of risk assets in the face of a more challenging macro environment driven by higher rates and energy costs.

Current View

The stock market dropped yesterday as Treasury yields surged following hot economic data, raising fears of further interest rate hikes from the Federal Reserve. The 10-year Treasury yield jumped 15 basis points to 5.12%, a 19-year high that goes back to July 2007, after a strong report on manufacturing and services. There is now a 70% probability of another quarter-point rate increase in October – – up from about 50% Tuesday. Early in today’s market action, rising oil prices were back in focus and hurting stocks. The bench-mark 10-year Treasury yield is up again. The 10-year Treasury yield moved up four basis points to to 5.15% after the 30-year earlier reached its highest level since 2004.  The macro market trend remains strong as the current signal is Market in Confirmed Uptrend. As sector rotation and price swings are accelerating along with rising rates, the market’s trend can change quickly.

  • Industry Group Strength:  NEUTRAL. As of yesterday, 74 out the 145 groups I monitor are up year-to-date. 71 are down.
  • New Highs vs. New Lows: BEARISH.  In yesterday’s session, there were 86 new 52-week highs and 571 new 52-week lows.
  • Dow Dividend Yield:  BEARISH. The current yield for the Dow Jones Industrial Average is 1.68%. The 10-year Treasury now 5.14%, back to where is was in 2007.
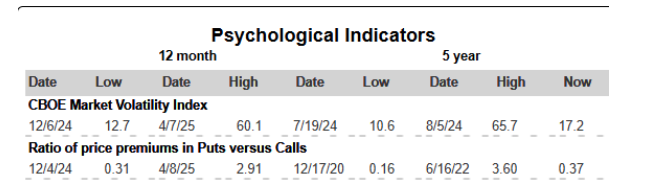
  • Volatility Index:  BEARISH. Volatility has been volatile. The “VIX” is now 16, down from 18 two weeks ago. The index is also known as the “Fear Index.” It is considered a contrarian indicator and therefore viewed as bullish as it rises indicating investors are becoming more fearful. The VIX:
502fdd07-23bc-47a7-ad04-cc3b3f2387db image
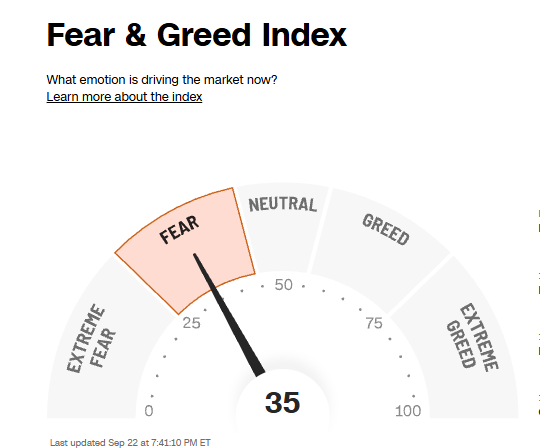
  • Fear / Greed Index:  BEARISH.  Investors are driven by two emotions: fear and greed. Too much fear can create a condition of oversold/ undervalued stock prices. Too much greed can result in overbought/overvalued stock prices. The AAII Investor Sentiment Index is now neutral.   BE FEARFUL WHEN OTHERS ARE GREEDY. At 35, the Fear & Greed Index is down from 46  two weeks ago.

CLICK VIDEO FOR MORE ON THE “FEAR & GREED INDEX”

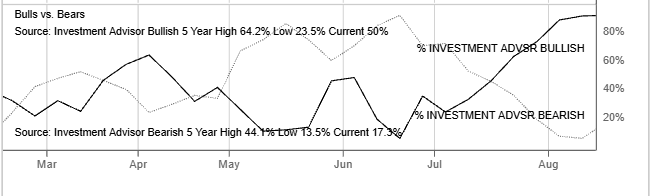
  • Bull / Bear Barometer:  NEUTRAL. This secondary market indicator should also be viewed with a contrarian perspective. As of yesterday, according to the latest survey of stock market newsletter writers by Investor’s Intelligence, the bullish tally is 51.9%, up from 50% two weeks ago. The bears are 15.4%, down from 17.3% two weeks ago. Consider this a contrarian indicator because the crowd is often wrong at market tops and bottoms. In other words, extreme bullishness has been seen near several market tops in the past, while extreme bearishness has been seen at market bottoms.
  • Put / Call Ratio: BEARISH. The ratio of put-to-call options is .67, down from 0.84 two weeks ago. The put-call ratio tracks the mood of what options investors are doing, not just saying. They typically buy puts if they think a stock will decline and calls if they think it will rise. If they’re buying lots of puts, they see the market declining. And if they’re loading up on calls, they’re generally bullish. Historically, market bottoms occurred when the reading spikes to 1.2 or more. Market tops are often made when the reading is 0.6 or less. Note how reliable this is with respect to the February record low coinciding with the market high. Keep in mind this is also a contrarian indicator.

ECONOMIC UPDATES

Global Economic Indicators & Analysis:

POSITIVE INDICATORS

Jobless Claims Down: Initial Jobless Claims decreased to 197,000 in the last week ending from 198,000 in the previous week. Initial Jobless Claims in the United States averaged 359,000 from 1967 until 2026, reaching an all time high of 613,700 in April of 2020 and a record low of 162,000 in November of 1968. Economists had forecasted a higher total of 201,000 claims. The four-week moving average decreased by 1,750 to 202,250.

Retail Sales Up: Retail sales in the US increased 1.2% month-over-month in August 2026, the most in five months, following a revised 0.5% fall in July which was the first decline since October 2025, and compared to forecasts of a 0.8% gain. Sales at gasoline stations recorded the biggest increase (3.1%), followed by non-store retailers (2.6%). Sales excluding food services, auto dealers, building materials stores and gasoline stations, which are used to calculate GDP, jumped 1.4%, much higher than forecasts of 0.4%.

US Service Index Up: The S&P Global US Services PMI rose to 58.7 in September of 2026 from 56.5 in the previous month, well above the market consensus of 56 to reflect the strongest expansion in services activity in over five years. New orders rose the most in over four years, underpinned by strong demand from domestic consumers, enough to offset lower export orders as unpredictable tariff policy shunned a group of international clients. The jump in business demand drove work backlogs to continue accumulating. Likewise, the need for higher capacity lifted employment growth to its highest since June 2022, not far from a survey record. This was despite input cost inflation hitting its highest in nearly four years, with the war in Iran prompting fuel and transportation costs to surge. Looking ahead, business confidence remained below trend due to cost-of-living concerns.

US Manufacturing Index Up: The S&P Global US Manufacturing PMI jumped to 57.0 in September 2026 from 53.9 in August, well above market expectations of 53.6, according to the flash estimate. The reading marked the strongest improvement in manufacturing business conditions since May 2022, with all five components contributing to the increase. Production growth rebounded after weakening over the previous three months, reaching its fastest pace since April 2022, while new orders accelerated to their strongest rate in nearly four and a half years. Employment growth rose to its highest level since February 2021, while inventories also increased at a faster pace. Meanwhile, supplier delivery times lengthened to the greatest extent since July 2022.

WEAK INDICATORS

LEI Down: The Conference Board Leading Economic Index(LEI) for the US decreased by 0.1% in August 2026 to 99.5, after an increase of 0.2% in July. As a result, the LEI’s six-month growth was –0.1% between February and August 2026, a much smaller rate of decline compared to –0.6% over the previous six months. August was the first monthly decline since March of this year. Due to the latest decline, the LEI’s six-month growth rate turned back to slightly negative, suggesting a less certain economic environment ahead.

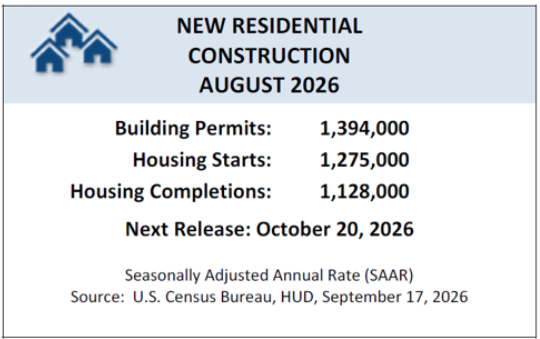
Housing Starts & Permits Down: Privately-owned housing starts in August were at a seasonally adjusted annual rate of 1,275,000. This is 2.6% below the revised July estimate of 1,309,000 and is 1.2% below the August 2025 rate of 1,291,000. Single-family housing starts in August were at a rate of 918,000; this is 7.6% above the revised July figure of 853,000. Privately-owned housing units authorized by building permits in August were at a seasonally adjusted annual rate of 1,394,000. This is 2.7% below the revised July rate of 1,433,000, but is 3.5% above the August 2025 rate of 1,347,000.

Empire State Index Down: The New York Fed’s Empire State Manufacturing Index fell 13 points to 7.6 in September 2026 from 20.6 in August, missing expectations of 14.75 and pointing to a moderation in manufacturing activity. New orders increased only slightly, while shipments edged lower, and unfilled orders rose as delivery times lengthened significantly. Supply availability also continued to deteriorate. Employment remained solid, with the employee index at 10.6, while the average workweek index climbed 10 points to 17, its highest level in nearly five years. At the same time, inflationary pressures intensified, with the prices paid index rising five points to 63.1, slightly above its recent four-year high, and prices received increasing to 28.1. Despite these cost pressures, manufacturers remained optimistic about the outlook. The future business conditions index stood at 29, with firms expecting stronger orders, shipments and employment in the months ahead.

Call me if you have any questions.  I am always happy to help!

John J. Gardner, CFP®, CPM®.

Blackhawk Wealth Advisors, Inc.

3860 Blackhawk Rd. Ste. 160 Danville, CA. 94506

Phone: 888-985-PLAN · Email: jg@blackhawkwealthadvisors.com

BLACKHAWKWEALTHADVISORS.COM