ERPE Excerpts 9.10.26 – Midterm Elections 2026…

Midterm Elections 2026:
5 Factors to Consider
The mid-term elections are quickly approaching, and markets have begun to price in the potential impacts of the vote. Races in the House of Representatives and the Senate will likely influence fiscal policy, alter the geopolitical landscape, and weigh on a wide array of economic and non-economic issues. Ahead of the vote, I’ve gathered visuals covering 5 topics that should be top of mind for investors; and to help “set the stage” leading up to the mid-terms on November 3rd.
#1. Prediction Markets Favor Republicans Maintaining Control of the Senate and Democrats Winning the House…
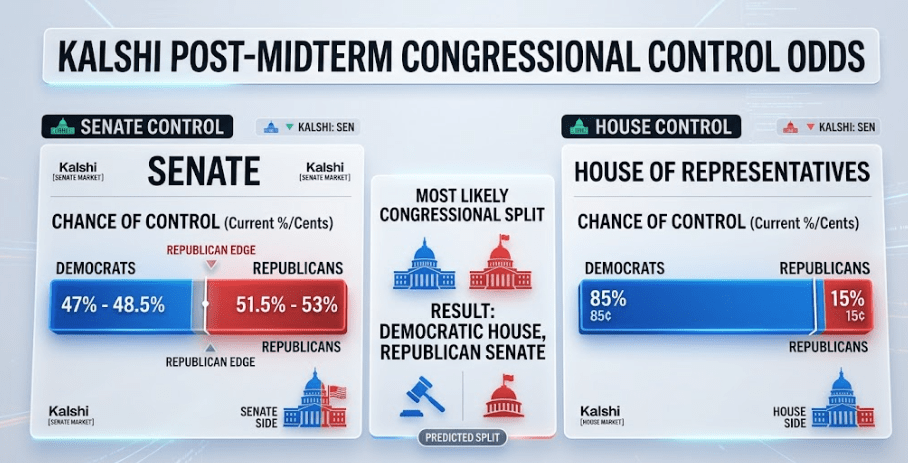
The current contract pricing on Kalshi gives a breakdown of the overall balance of power – –
House of Representatives: Kalshi places the Democrats as the heavily favored party to gain control, trading at roughly 85% probability, compared to Republicans at 15%.
Senate: Kalshi’s Senate control board shows a tight, nearly split race. Republicans hold a edge at around 51.5% to 53% probability, while Democrats sit right behind at roughly 47% to 48.5%.
Most Likely Congressional Split: The single highest-probability outcome priced across Kalshi’s combined congressional markets is a Democratic House paired with a Republican Senate.
#2. Rising oil, increasing inflation, AI spending and impacts of the One Big Beautiful Bill….
Economics matter!
#3. President’s Party Punished…
Since 1946, the President’s party has lost House seats 18 of the last 20 midterms.
Source: US House of Representatives
#4. Markets are Far Less Partisan; Volatility is Normal in Mid-term Years and Returns Tend to Improve After the Vote…
The S&P 500’s average return after the election is 13%.
#5. A divided Congress has been good for the S&P 500…
A CNBC study showed between 1951 through 2023, a divided Congress tends to bode well for investors. Average gains of 15.7% under Democratic presidents and 13.7% under Republican presidents.

TAKING PERSPECTIVE…

Proper Perspective:  In our hectic and often hard to comprehend world, it is very easy to lose perspective. You may agree it is sometimes difficult to see the big picture. The media often doesn’t help with this, but unfortunately instead encourages us to see things in a most negative light. Here is hopefully a pause to gain positive perspective.

MARKET ANALYSIS

INDICATORS OF INTEREST:
  • Market’s Current Signal: Uptrend Under Pressure.  Analysis of the stock market over 130 years of history shows we can view it in terms of three stages -market in uptrend, uptrend under pressure and market correction.  Since the 1880’s, this perspective has led to investment out-performance relative to market indexes. This is due to trend analysis which determines risk reducing, return enhancing market entry and exit points.
Starting June 1 the market’s trend strength weakened as an increasing number of heavy distribution days mounted. On June 23, with the Nasdaq shouldering eight instances of pronounced professional selling, the market’s Confirmed Uptrend signal flashed a trend change to Uptrend Under Pressure. As the index received its ninth distribution day within a 25-session time frame on July 2, indicators began to flash more caution. July 24’s market action came close to a trend change to Market in Correction. That reversed positively to a trend turnaround to Confirmed UptrendAugust 4 and was further confirmed with a follow-through August 27. Since then the market has weakened as rally attempts have failed in the face of higher oil prices, increased inflation pressures and climbing interest rates. The current market signal is Uptrend Under Pressure.
Here are key market levels as of Monday, September 7:
Recapping Last Week
Global equity markets were quietly choppy this week as investors grappled with a rise in global bond yields, a renewed escalation in U.S.-Iranian hostilities and a shifting outlook for Fed policy. U.S. equities came under pressure early in the week as the global bond selloff and higher energy prices challenged elevated valuations, although stocks recovered as the week progressed, with the S&P 500, Nasdaq 100, and Russell 2000 posting modest gains of under a half a percent. The markets were ultimately awaiting the Friday release of the August employment report, which showed payrolls rising a robust 162k versus expectations of 55k along with a revision to July’s report to reflect growth in payrolls of 21k compared to the initially reported decline of 23k. The surprisingly strong report pushed market expectations for a 25 bps hike in the Fed Funds target rate to 58%. While U.S. Treasury yields were pretty much flat on the week, the bond selloff story took on an international focus with the 10-year Japanese Govt Bond moving above 3% for the first time since 1996 and similar-maturity German Bunds making 15-year highs. The increase in energy prices resulting from the resumption in military hostilities with Iran and the potential for inflationary pressures to be felt more “downstream” is most readily apparent in the price for diesel, which is near the highs seen during the early onset of the war. Alongside the inelastic steady demand from the global trucking and shipping industry, the seasonal marginal increase in demand resulting from Northern Hemisphere farmers preparing for the fall harvest and the roughly 17% of homes in the Northeast U.S. that utilize the fuel to heat their homes will be exposing those populations to the sticker shock. The refiners benefiting from “heat (diesel) crack” spreads of $100 a barrel led the Energy sector to be the week’s strongest performer amongst the S&P 500 sectors, with Consumer Discretionary correspondingly the worst, at up over 2% and down nearly 2%, respectively. The other macro sectors that we routinely address (currencies, precious metals, and crypto) all offered initial knee-jerk reactions to the increased expectation of a rate hike resulting from the strong jobs report but spent the rest of Friday’s session retracing most or all of it back. The most notable move in currencies saw the USD weaken against the Japanese Yen back to the lows seen in the immediate aftermath of the coordinated intervention. A daily chart of the USD/JPY very much reflects an “escalator up, elevator down” nature of certain markets.
Current View
Stocks struggled yesterday as the conflict between the U.S. and Iran drove Brent oil, the international benchmark, beyond $101 a barrel for the first time since July. As oil prices scaled higher, energy was the only sector in the S&P 500 that gained ground. The index’s 10 other groups slumped. Also yesterday the 10-year Treasury yield settled at 4.83%, its highest level since Oct. 31, 2023, per Dow Jones Market Data. Yields rise as prices fall. As noted above, the current market signal is “Uptrend Under Pressure”.
  • Industry Group Strength:  BEARISH. As of yesterday, 61 out the 145groups I monitor are up year-to-date. 84 are down.
  • New Highs vs. New Lows: BEARISH.  In yesterday’s session, there were 191 new 52-week highs and 276 new 52-week lows.
  • Dow Dividend Yield:  BEARISH. The current yield for the Dow Jones Industrial Average is 1.66%. The 10-year Treasury now 4.92%, back to where is was in July of 2007.
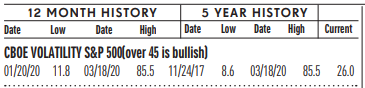
  • Volatility Index: BEARISH. Volatility has been volatile. The “VIX” is now 18. This is about the same as two weeks ago. The index is also known as the “Fear Index.” It is considered a contrarian indicator and therefore viewed as bullish as it rises indicating investors are becoming more fearful. The VIX:
502fdd07-23bc-47a7-ad04-cc3b3f2387db image
  • Fear / Greed Index:  BEARISH.  Investors are driven by two emotions: fear and greed. Too much fear can create a condition of oversold/ undervalued stock prices. Too much greed can result in overbought/overvalued stock prices. The AAII Investor Sentiment Index is now neutral.   BE FEARFUL WHEN OTHERS ARE GREEDY. At 55, the Fear & Greed Index is up from 46  two weeks ago.
CLICK VIDEO FOR MORE ON THE “FEAR & GREED INDEX”
  • Bull / Bear Barometer:  NEUTRAL. This secondary market indicator should also be viewed with a contrarian perspective. As of yesterday, according to the latest survey of stock market newsletter writers by Investor’s Intelligence, the bullish tally is 50%, up from 49.1% two weeks ago. The bears are 17.3%, up from 17% two weeks ago. Consider this a contrarian indicator because the crowd is often wrong at market tops and bottoms. In other words, extreme bullishness has been seen near several market tops in the past, while extreme bearishness has been seen at market bottoms.
  • Put / Call Ratio: BEARISH. The ratio of put-to-call options is .84, up from 0.61 two weeks ago. The put-call ratio tracks the mood of what options investors are doing, not just saying. They typically buy puts if they think a stock will decline and calls if they think it will rise. If they’re buying lots of puts, they see the market declining. And if they’re loading up on calls, they’re generally bullish. Historically, market bottoms occurred when the reading spikes to 1.2 or more. Market tops are often made when the reading is 0.6 or less. Note how reliable this is with respect to the February record low coinciding with the market high. Keep in mind this is also a contrarian indicator.

ECONOMIC UPDATES

Global Economic Indicators & Analysis:
POSITIVE INDICATORS
Jobless Claims Down: Initial jobless claims in the U.S. fell by 1,000 to a seasonally adjusted 206,000 for the last week, according to the Labor Department today. Economist Forecast was 205,000. Claims remain stable and low, staying within a tight 189,000 to 212,000 range since mid-July. Low layoff numbers indicate a steady labor market finding its footing after earlier summer fluctuations.

WEAK INDICATORS

PPI Up: Wholesale inflation advanced largely in line with expectations in August, data released today by the Bureau of Labor Statistics showed. The “core” reading — which excludes the more volatile food and energy costs — showed producer prices advanced by 0.2% over the previous month. That was slightly below the 0.3% growth economists had predicted and July’s revised gain of 0.3%. On a year-over-year basis, headline prices rose by 5.4% in August, slightly above estimates of 5.3% and advancing over the previous month’s revised 4.8% print. Core inflation came in at 4.6%, in line with estimates but above July’s gain of 4.2%.
Existing Home Sales Down: Home sales fall in August despite the highest supply in over a decade. Existing home sales fell 2% in August compared with July. There was a 4.9-month supply of homes for sale at the end of August. According to the National Association of Realtors today, the sales activity marked the slowest pace since June 2025 and was felt hardest in the Northeast and Midwest. Sales were down 1.2% year over year. Despite more supply, prices continue to rise. The median price of a home sold in august was $429,100, up 1.6% from August 2025. That is a new record high for the month of August. Today the 30-year fixed rate mortgage rate topped 7%.
NFIB Optimism Index Down: The US NFIB Small Business Optimism Index fell to 98.7 in August 2026 from 99.8 in July and below forecasts of 99.3. Actual sales worsened, with a net negative 9% of owners reporting higher nominal sales in the past three months, the lowest since November 2025. Reports of inflation as the single most important problem increased to 16%, now tying with taxes as the second top small business issue. Reports of “labor quality or availability” and “labor costs” as owners’ single most important problem eased, with “labor costs” dropping to its lowest level since March 2021. “Uncertainty remains elevated among small business owners as they face a mixed set of challenges with weakened sales, supply chain disruptions, and inflation pressures”, said the NFIB’s Chief Economist.
Call me if you have any questions.  I am always happy to help!
John J. Gardner, CFP®, CPM®.
Blackhawk Wealth Advisors, Inc.
Phone: 888-985-PLAN · Email: jg@blackhawkwealthadvisors.com