ERPE Excerpts 7.30.26 – Small Caps

Small Cap Stocks:
Perspective and Potential
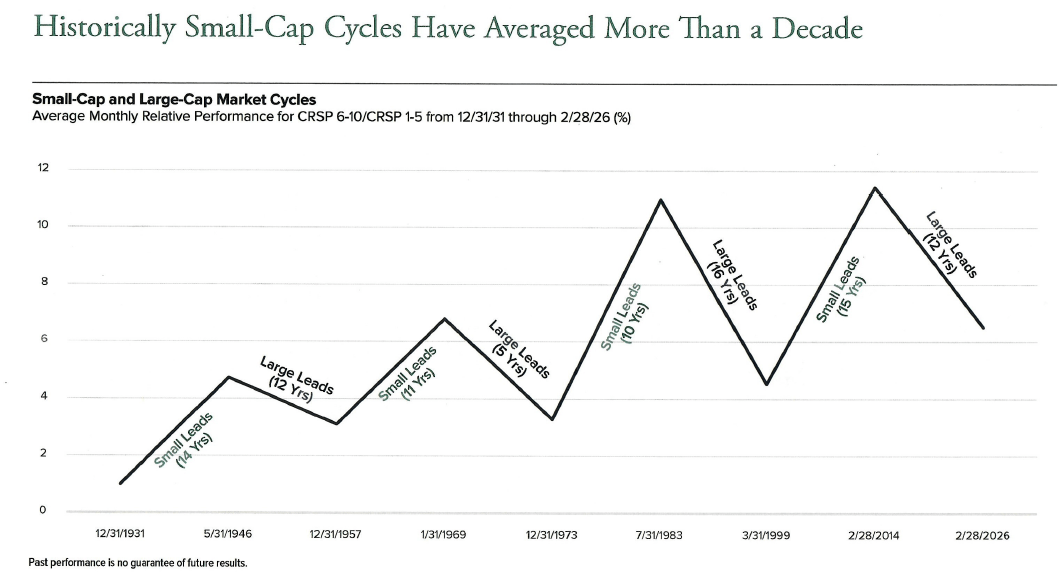
This year’s stock market’s first half feels to many like two years. Half of the half (Q1) and the other half (Q2) were significantly opposite, yet both delivered extreme volatility and uncertainty. The bearish market behavior and negative returns in large part due to the War in Iran in Q1 rebounded strongly in Q2. The second half of the first half was powerfully bullish and led by the small cap stock index. Strengthening fundamentals, attractive relative valuations, and growing earnings strength provided a spark to small-cap stocks to lead the bull run. That trend has the potential to continue. I have attached graphs below that offer historical perspective on this equity asset class.
The small-cap “space” tends to move in cycles. Research indicates small-caps may now be early in a new cycle. Looking ahead, the backdrop the asset class remains constructive over the longer term. Improving earnings growth, attractive relative valuations, and the potential for lower borrowing costs continue to provide a supportive backdrop for the asset class. Risks persist, though, especially regarding interest rates. While the Fed did not raise rates yesterday, it is clear inflation pressures exist, and an increased cost to borrow may occur by year end.  The first of my graphs shows the cyclical nature of small-cap stocks.
Graph 2, below, offers a long-term perspective of the small-cap asset class relative to its down cycles and bounce-back potential.
The 3rd graph provides perspective on the history of inverse relationship between the performance of small-caps vs the mega-caps. Notice that while individual stock dominance changes over time, the weighted impact on the market remains the same.
Graph 4 tells the earnings story. The relative strength in small-cap’s is mainly a function of a turn-around in earnings. The trend is our friend.
My 5th graph speaks to small-cap’s and inflation. The long-term view shows how the asset class has performed over the decades.
Another long-term perspective on the performance of the small-cap asset class. One of my Top Ten Investment Tenets is, “It’s not timing the market, it’s time in the market.”  The smalls are a good example.
Continued outperformance by the small-cap’s is expected from future positive earnings. Here’s some catalysts that may boost that earnings growth…
When it comes to the future direction of stocks, from individual securities to the major market indexes, earnings are always a key driver. Earnings fundamentals have continued to improve across much of the small-cap universe. Stronger earnings growth, combined with attractive relative valuations, has been an important reason for the recent small-cap performance. I believe these fundamentals continue to create compelling opportunities for active, long-term investors focused on identifying high-quality businesses with durable competitive advantages and disciplined capital allocation. The perspective gained from the historical graphs above underscore that potential.

TAKING PERSPECTIVE…

Proper Perspective:  In our hectic and often hard to comprehend world, it is very easy to lose perspective. You may agree it is sometimes difficult to see the big picture. The media often doesn’t help with this, but unfortunately instead encourages us to see things in a most negative light. Here is hopefully a pause to gain positive perspective.
Famous Quote For Today:  “Iraq is an unjust war.”
~~Jimmy Carter, 2005
Today in History –  On this day, in 1956, the phrase “In God We Trust” was adopted as the U.S. motto.

MARKET ANALYSIS

INDICATORS OF INTEREST:
  • Market’s Current Signal: Uptrend Under Pressure.  Analysis of the stock market over 130 years of history shows we can view it in terms of three stages -market in uptrend, uptrend under pressure and market correction.  Since the 1880’s, this perspective has led to investment out-performance relative to market indexes. This is due to trend analysis which determines risk reducing, return enhancing market entry and exit points.
Since June 1 the market’s trend strength has weakened as an increasing number of heavy distribution days entered the equation. On June 23, with the Nasdaq shouldering eight instances of pronounced professional selling, the market’s Confirmed Uptrend signal flashed a trend change to Uptrend Under Pressure. As the index received its ninth distribution day within a 25-session time frame on July 2, indicators began to flash more caution. July 24’s market action came close to a trend change to Market in Correction, which flashed again yesterday. This deserves close attention.
Here are key market levels as of Monday, July 27:
Recapping Last Week
The dominant theme in U.S. equity markets last week was the sharp repricing of hyperscalers, prompted by investors showing little tolerance for rising capital expenditures tied to AI infrastructure. The semiconductor sector, which has been one of the primary beneficiaries of those capital outlays, regained its footing after bearing the brunt of the market’s punishment in the preceding week. The sharp rotation that we’ve been highlighting amongst sectors now is most dramatic within the tech sector itself. Earlier in the year featured AI stocks vs traditional software while now the focus is on chipmakers and their customers with a seemingly unsatiable appetite, the hyperscalers. World benchmark Brent crude oil pushed through $100 per barrel on Thursday before backing off a little on Friday as hostilities between the U.S. and Iran threatened not only to continue, but potentially to escalate. Refining margins, as measured through crack spreads, remained elevated, which led the Energy sector to rally over 3% on the week. That made it the best performer, while the Consumer Discretionary sector was the worst, falling over 5%. While this seems like a clear cause-and-effect scenario, remember that Consumer Discretionary has a fair amount of “big tech” in it, given its two largest components are Amazon and Tesla. The worrisome rise in energy prices spilled over to other sectors, and led Treasury yields to rise across the curve and the dollar caught a bid, most notably against the Yen. The widening interest rate differentials between the U.S and Japan overrode short-term traders fears of BOJ intervention and fueled carry trades. You’ll recall that the release of June’s benign inflation data the preceding week comforted the markets, with Fed Fund futures pricing reducing the chance of a July rate hike to 10%. Last week’s turmoil removed that comfort, with Fed Fund futures once again suggesting a 1 in 3 chance that the Open Market Committee could hike rates at the yesterday’s (July 29th) meeting. Friday also saw President Trump replace his expiring global 10% tariffs with a new program, that charges either a 12.5% or 10% rate depending on the target country/trading block’s policies regarding the import of goods produced by forced labor. This policy leverages a section of U.S. code that the administration believes will better withstand judicial challenges. Precious metals and crypto each caught a little bid early in the week only to give back most (metals) or all (crypto) of these gains by the end of the week, as global instability and higher U.S. interest rates supporting the dollar acted as countervailing forces.
Current View
Yesterday was the worst day for the Dow since April of 2025. The major indices did not applaud new Fed Chair Warsh’s decision to leave interest rates unchanged. It also did not help that oil’s price spike continues. Brent crude jumped 7.9% ahead to $90.74. It has soared 24.4% in July through yesterday. Most of yesterday’s decline came in the final half hour of stock market action . For several years now, semiconductor stocks have led the upside. Yesterday, the sector took a further step into bear market territory. The iShares Semiconductor (SOXX) exchange traded fund, down 5.4% to 465 for the day, has now fallen almost 30% below its June peak of 655.95. In the stock market, bear declines are defined as a 20% correction from a 52-week or all-time high or more. A stark example is Applied Materials (AMAT). It dropped 8.4% to 436.45 yesterday. The giant in semiconductor manufacturing gear is down 18.6% for the week. It’s fallen 41% from a peak 739.67 on June 30. That massive fall in just one month came after an even bigger run up of 60% in May. Those are extremely volatile monthly moves.
Today the E’s are boosting the stock market: Earnings & Economics. As noted above, meaningful economic indicators are positive. Earnings are doing there part in 2026 with Q1 and Q2 earnings growth above 20% year-over-year.
  • Industry Group Strength:  BEARISH. As of yesterday, 65 out the 145groups I monitor are up year-to-date. 80 are down.
  • New Highs vs. New Lows: BULLISH.  In yesterday’s session, there were 267 new 52-week highs and 235 new 52-week lows.
  • Dow Dividend Yield:  BEARISH. The current yield for the Dow Jones Industrial Average is 1.65%. The 10-year Treasury now 4.67%.
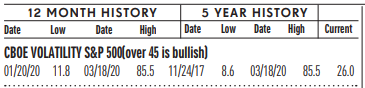
  • Volatility Index:  BEARISH. Volatility has been volatile. The “VIX” is now 18. This is up from 16 two weeks ago. The index is also known as the “Fear Index.” It is considered a contrarian indicator and therefore viewed as bullish as it rises indicating investors are becoming more fearful. The VIX:
502fdd07-23bc-47a7-ad04-cc3b3f2387db image
  • Fear / Greed Index:  BULLISH.  Investors are driven by two emotions: fear and greed. Too much fear can create a condition of oversold/ undervalued stock prices. Too much greed can result in overbought/overvalued stock prices. The AAII Investor Sentiment Index is now neutral.   BE FEARFUL WHEN OTHERS ARE GREEDY. At 38, the Fear & Greed Index is down from 46  two weeks ago.
CLICK VIDEO FOR MORE ON THE “FEAR & GREED INDEX”
  • Bull / Bear Barometer:  NEUTRAL. This secondary market indicator should also be viewed with a contrarian perspective. As of yesterday, according to the latest survey of stock market newsletter writers by Investor’s Intelligence, the bullish tally is 49.1%, down from 50.9% two weeks ago. The bears are 17%, down from 20% two weeks ago. Consider this a contrarian indicator because the crowd is often wrong at market tops and bottoms. In other words, extreme bullishness has been seen near several market tops in the past, while extreme bearishness has been seen at market bottoms.
  • Put / Call Ratio: BEARISH. The ratio of put-to-call options is .84, up from 0.61 two weeks ago. The put-call ratio tracks the mood of what options investors are doing, not just saying. They typically buy puts if they think a stock will decline and calls if they think it will rise. If they’re buying lots of puts, they see the market declining. And if they’re loading up on calls, they’re generally bullish. Historically, market bottoms occurred when the reading spikes to 1.2 or more. Market tops are often made when the reading is 0.6 or less. Note how reliable this is with respect to the February record low coinciding with the market high. Keep in mind this is also a contrarian indicator.

ECONOMIC UPDATES

Global Economic Indicators & Analysis:
POSITIVE INDICATORS
GDP Up: Real gross domestic product (GDP) increased at an annual rate of 1.5% in the second quarter of 2026 (April, May, and June), according to the advance estimate released today by the U.S. Bureau of Economic Analysis (BEA). In the first quarter, real GDP increased 2.1%. The contributors to the increase in real GDP in the second quarter were increases in consumer spending, investment, and exports that were partly offset by a decrease in government spending. Compared to the first quarter, the deceleration in real GDP in the second quarter reflected a downturn in government spending and decelerations in investment and exports that were partly offset by an acceleration in consumer spending. Imports increased more in the second quarter than in the first quarter.
PCE Down: The Bureau of Economic Analysis released the June personal consumption expenditures price index data today. Inflation slowed in June while economic growth also cooled in the second quarter of this year.  Headline PCE, which includes food and energy, showed prices decreased 0.1% from the month prior, according to data released by the Bureau of Economic Analysis. Over the prior year, prices increased 3.7%. This marked a slowdown from the 0.5% monthly increase and 4.1% annual gain seen in May.
US Services Up: The S&P Global US Services PMI rose to 53.6 in July of 2026 from 51.2 in the previous month, marking the fastest expansion in services sector activity so far this year, according to a flash estimate. Output was supported by a larger intake of new work for companies, with companies noting a pickup in activity due to FIFA World Cup spending and higher investments in sales, marketing, and product development. Still, the impact of the war in Iran, mainly though higher energy prices that lifted operating cars and squeezed consumers’ purchasing power, continued to impact activity levels. Therefore, employment growth was only marginal. Input prices for the sector grew to a 14-month high, and output inflation surged to its highest in nearly four years. Despite inflationary risks, the sentiment gauge rose to a one-year high.
Durable Goods Order’s Up: New orders for US-manufactured durable goods increased 0.3% month-over-month to $334.77 billion in June 2026, rebounding from a revised 4% slump in May but much lower than forecasts of a 1.6% jump. Business investment has remained resilient this year, supported by robust spending on AI and a war-related increase in US defense orders.
Personal Income Up: US personal income increased by 0.7% month-over-month in May 2026, surpassing market expectations of a 0.4% rise and accelerating from a flat reading in April. It marked the strongest monthly gain since July 2025, driven largely by a surge in farm proprietors’ income, which rose by $59.6 billion following payments under the American Relief Act of 2025. During the month, the USDA issued a second round of Supplemental Disaster Relief Program payments to producers. Proprietors’ income with inventory valuation and capital consumption adjustments rose by $84.6 billion, while employee compensation increased by $66.8 billion, including a $57.1 billion gain in wages and salaries. Private-sector wages climbed by $48.7 billion, while government wages increased by $8.4 billion. Meanwhile, disposable personal income rose 0.7%, or $164.9 billion, rebounding from a 0.1% decline in April. Real disposable personal income also increased by 0.3%, following a 0.5% drop in the previous month.
Personal Spending Up: US personal spending rose by 0.7% month-on-month in May 2026, or $156.1 billion, accelerating from a downwardly revised 0.4% increase in April and beating market expectations of a 0.6% gain. Spending on goods rose by $61.8 billion, primarily driven by a $21 billion surge in gasoline and other energy goods amid soaring energy prices tied to the Middle East conflict. Additional gains were seen in recreational goods and vehicles ($7 billion), motor vehicles and parts ($5.3 billion), food and beverages ($4.6 billion), and other nondurable goods ($13.7 billion). Spending on services climbed by $94.3 billion, led by financial services and insurance ($28.4 billion), housing and utilities ($22.3 billion), and health care ($22.3 billion).
New Home Sales Up: Sales of new single-family homes in the US increased 1.6% month-over-month to a seasonally adjusted annualized rate of 628 thousand in June 2026, following a revised 4.3% drop to 618 thousand in May and compared to forecasts of 610 thousand. The increase, the first in three months, likely reflected continued discounting by builders, who have been offering incentives and reducing prices to support demand amid challenging market conditions. Sales rose in the South (9.9% to 412 thousand), the Northeast (3.6% to 29 thousand), and the Midwest (2.5% to 83 thousand), but fell 22.4% to 104 thousand in the West. Meanwhile, housing supply edged down 0.2% to 485,000 units, equivalent to 9.3 months of supply at the last sales rate. Also, the median sales price of homes was at $398,300, compared to $412,000 in May and $409,200 a year earlier.

WEAK INDICATORS

Jobless Claims Up: U.S. initial jobless claims rose by 9,000 to a seasonally adjusted 197,000 for the week ending July 25, 2026, coming in below the 200,000 to 201,000 claims expected by economists and rebounding slightly from the prior week’s upwardly revised 188,000. Despite the modest weekly increase, filings remain near historic lows matching levels not seen consistently since 1969. Analysts note that layoff activity remains deeply subdued and the labor market continues to show broad stability, holding under consensus forecasts.
US Manufacturing Down: The S&P Global US Manufacturing PMI edged down to 53.8 in July 2026 from 53.9 in June, falling short of market expectations of 54.3, according to the preliminary estimate. Despite the slight decline, the index remained close to its highest levels in more than four years. The modest slowdown reflected a sharp easing in production growth, which weakened to its slowest pace since March, while new orders expanded at the weakest rate in four months. Slower inventory accumulation, following exceptionally strong stockbuilding in May and June, also weighed on the headline PMI. These headwinds were partly offset by a renewed increase in factory employment and longer supplier delivery times. Unlike the delays typically associated with strong demand, the latest deterioration in supplier performance was primarily linked to supply disruptions stemming from the Middle East.
Call me if you have any questions.  I am always happy to help!
John J. Gardner, CFP®, CPM®.
Blackhawk Wealth Advisors, Inc.
Phone: 888-985-PLAN · Email: jg@blackhawkwealthadvisors.com