ERPE Excerpts 7.16.26 Mid-Year Outlook 2026

Bi-MONTHLY MARKET ANALYSIS &
ECONOMIC UPDATES
July 16, 2026
Mid-Year Outlook 2026:
Key Lessons for the Seventh Year of the Cycle
As we begin the second half of the year, I wanted to share a mid-year market update with my current perspectives. This includes the key themes shaping markets and what they may mean for your investment portfolio.
Markets Were Strong in the First Half of the Year
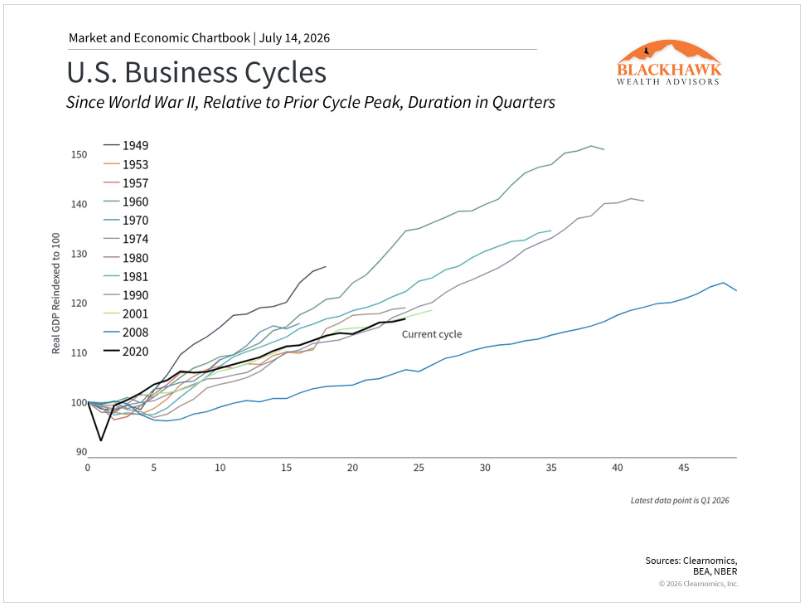
The first half of 2026 was a reminder of why staying invested and maintaining a long-term perspective matters. Markets climbed to new all-time highs, corporate earnings grew at a double-digit pace, and a wide range of asset classes delivered strong returns. This all occurred even as the war in Iran, rising energy prices, and uncertainty around the Federal Reserve created short-term turbulence along the way. Perhaps the most important context is that the current business cycle is now in its seventh year and is going strong. You will see that in the graph below. There have been several moments in recent years when a recession seemed possible, including when inflation peaked in 2022 and when tariffs disrupted trade last year. However, the economy has been resilient throughout these periods and continues to grow.
Today, the economic picture remains broadly positive. The job market has strengthened this year, with payroll growth now averaging 111,000 jobs per month, above the long-term average. Consumer spending has also held up, business investment has accelerated due to AI trends, and the dollar has stabilized. So, consumers and corporations – two of the three legs of the “economy stool” – are solid. The third leg is the government. We know they are spending!
One potential challenge is that inflation remains elevated, largely because of higher energy prices. While the peace deal framework and ceasefire with Iran have been tentative, oil prices have still declined back toward their pre-conflict levels. This suggests that inflation may be near its high point for this cycle, although there are no guarantees on how this develops. However, this week’s CPI report may be the beginning of a less troublesome inflation condition.
Steady economic growth has supported the stock market, with the S&P 500 reaching 24 new all-time highs so far this year. The S&P 500 returned 9.6% in the first half, while the Nasdaq gained 12.8% and the Dow Jones Industrial Average rose 8.9%. The second quarter was particularly strong, with the S&P 500 returning 14.9%. This was due to the timing of the market rebound, which began at the end of March. Apparently shrugging off the war, the U.S. stock market rallied in Q2 boosted by super-strong earnings. I think earnings have been the star of the show in 2026.
First quarter earnings season kicked-off in April and gave investors a lot to cheer. The SP 500 reported 28.6% earnings growth in Q1. That was the highest since Q4 2021. With Q2 earnings officially underway now, it is likely to be only the 6th time in history that SP 500 earnings grow by 20% or more in two consecutive quarters.  Upcoming Q2 earnings are likely to exceed 21%. It’s been all about the tech sector, driven by AI. Technology is expected to play the dominant role again in 2Q26, with earnings growth +42%. Excluding the Tech sector’s substantial contribution, Q2 earnings growth for the rest of the S&P 500 index is expected to be +11.3%. It is worth noting that U.S. stock valuations are elevated, with the S&P 500 trading at roughly 20 times forward earnings, above the long-term average of 16 times. High valuations do not predict what markets will do in the near term, but they are an important consideration.
For bond holdings, the current yield environment is among the most attractive in recent decades. The Bloomberg U.S. Aggregate Bond Index yields approximately 4.7%, well above its average of 3.0% since 2009. Investment-grade corporate bonds yield 5.1%. Bonds do their job, providing a source of income and a stabilizing force in a balanced portfolio.
Looking Ahead to the Second Half
There will no doubt be more periods of market volatility ahead. Yes, you hear and read that everywhere – as you should. And you certainly won’t get a sense of a near term down-turn from the VIX, the investor’s fear index. Remember Warren’s wisdom, “Be fearful when others are greedy, and greedy when others are fearful.”Yesterday Mr. Buffett said something that may be quoted over and over in the years ahead. “It’s tough to find values when everybody is preferring gambling”, was his quote in an interview yesterday on the market now. Market swings from the war in Iran, speculation of the Fed’s next move, and higher-for-longer energy prices will lift inflation fears. Also, the November midterm elections will attract attention in the media. On that note, while it can be difficult to do, it’s important to keep our political views and financial goals separate. Markets have historically been positive under every combination of political party control. While headlines out of Washington D.C. may create short-term swings, the true drivers of markets are corporate earnings, economic fundamentals, and the business cycle. Note the two graphs below. They show volatility due to oil shocks and mid-term elections have historically been short-term.
Artificial intelligence investment demand is expected to further increase stocks supply the rest of this year. Large technology companies are investing heavily in AI infrastructure, and high-profile IPOs including OpenAI and Anthropic are anticipated later this year. In terms of dollars raised, the first half of 2026 rewrote the IPO record books, with U.S. share sales raising a staggering $251 billion by late June. The blockbuster SpaceX IPO — one of the largest share sales in history — alongside AI chipmaker Cerebras, accounted for a massive portion of the total capital raised. 2026 will potentially be the biggest IPO year ever by sheer capital raised. Overall, this reflects market optimism. The key lesson from prior technology cycles is to take a longer-term view. During periods of rapid innovation, it can be difficult to identify the long-term winners in advance. The largest technology stocks today have taken decades to grow into the companies they are today.
The bottom line? The first half of 2026 has rewarded investors who remained diversified and focused on the long term, even as geopolitical and economic headlines created short-term uncertainty. As we navigate the second half of the year, it’s important to remember that your portfolio is prudently aligned with this kind of market environment and your unique investor profile.
Please do not hesitate to reach out if you have any questions or would simply like to discuss what any of these developments mean for your specific situation and goals.
John

TAKING PERSPECTIVE…

Proper Perspective:  In our hectic and often hard to comprehend world, it is very easy to lose perspective. You may agree it is sometimes difficult to see the big picture. The media often doesn’t help with this, but unfortunately instead encourages us to see things in a most negative light. Here is hopefully a pause to gain positive perspective.
Famous Quote For Today:  “You can’t blame your opponents for applying a strategy that beats your brains out with regularity.”
~~ Bill Clinton, 1992
Today in History – On this day in 1935 – The world’s first parking meter is installed in Oklahoma City, Oklahoma.

MARKET ANALYSIS

INDICATORS OF INTEREST:
  • Market’s Current Signal: Confirmed Uptrend.  Analysis of the stock market over 130 years of history shows we can view it in terms of three stages -market in uptrend, uptrend under pressure and market correction.  Since the 1880’s, this perspective has led to investment out-performance relative to market indexes. This is due to trend analysis which determines risk reducing, return enhancing market entry and exit points.
The U.S. stock market’s current signal indicates the market is in Confirmed Uptrend. This trend change was triggered April 8, confirming a rally attempt on March 31. The bullish rally remains strongly intact. April was the best month for the stock market since 2020. May also delivered a strong gain. Between April and May, the last two months were the 2nd best April/May periods in stock market history.
Here are key market levels as of Monday, July 13:
Recapping Last Week
Concerns over the durability of the artificial intelligence rally and renewed geopolitical tensions in the Middle East dominated global equity markets this week. Selloffs in memory chip companies early in the week were tied to Samsung’s preliminary earnings report, in spite of the fact that the company forecasted a nearly 20-fold year-over-year increase in profits. Shares sold off 10% over worries that hyperscalers’ demand could fall. Late in the week, SK Hynix—another South Korean memory chip maker—countered this narrative, raising $26.5B in a 7x oversubscribed offering that marked the largest ever offering of shares by a foreign company in the U.S. This provided support to the thesis that investors still have an appetite to fund the enormous capital needs of the AI infrastructure buildout. Renewed hostilities in the Middle East prompted by the IRGC firing upon three ships transiting the Strait of Hormuz led President Trump to declare the cease fire over. The next two nights saw intense attacks against Iranian coastal installations intended to degrade their ability to further disrupt shipping. Before these events, crude oil prices had eased all the way back to pre-war levels. They spiked on the news but eased somewhat after Trump claimed that Iran was still interested in making a deal. Understandably, this all led to a great degree of sector churn as defensive names and energy benefited early in the week before risk appetites resumed later. S&P 500 sector wise, Energy, Technology, and Communication Services were the strongest performers, while Materials, Healthcare, and Consumer Staples were the weakest. The rise in energy prices and release of the FOMC minutes, which expressed concern that a combination of energy prices and massive AI buildout expenditures could keep inflation elevated, affected Treasuries as well. Yields on the long end of the curve pushed through 4.5% on the 10 year and back above 5% for the 30 year. In other macro sectors, precious metals were flat, the dollar eased slightly and the late week resumption of risk appetites firmed crypto a bit.
Current View
The Nasdaq composite outperformed with a 0.6% gain yesterday. Favorable earnings and economic news was the boost the tech-heavy index needed to rise for its fifth time in six sessions. The close above the 50-day moving average, which continues to ascend, added some sweetness to the session. This is despite a big hit to the memory makers, chip equipment makers and other AI infrastructure stocks. The U.S. stock market entered the Q2 earnings season this week, so expect increased volatility triggered by these corporate announcements with particular attention on their guidance through year end. The stock market rally is still intact, carried now by a healthy dose of rotation as financials, energy and healthcare sectors are outpacing moves in many tech groups.
Today the market gets more key economic data and a fresh batch of corporate earnings reports. So far in early trading, additional evidence of rotation is clear. Healthcare, for example, is acting healthy while some tech is tanking.
  • Industry Group Strength:  BEARISH. As of yesterday, 71 out the 145groups I monitor are up year-to-date. 74 are down.
  • New Highs vs. New Lows: BULLISH.  In yesterday’s session, there were 191 new 52-week highs and 98 new 52-week lows.
  • Dow Dividend Yield:  BEARISH. The current yield for the Dow Jones Industrial Average is 1.75%. The 10-year Treasury now 4.58%.
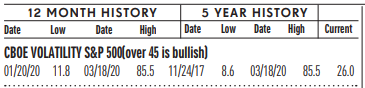
  • Volatility Index: BEARISH. Volatility has been volatile. The “VIX” is now 16. This is down from 17 two weeks ago. The index is also known as the “Fear Index.” It is considered a contrarian indicator and therefore viewed as bullish as it rises indicating investors are becoming more fearful. The VIX:
502fdd07-23bc-47a7-ad04-cc3b3f2387db image
  • Fear / Greed Index: NEUTRAL.  Investors are driven by two emotions: fear and greed. Too much fear can create a condition of oversold/ undervalued stock prices. Too much greed can result in overbought/overvalued stock prices. The AAII Investor Sentiment Index is now neutral.   BE FEARFUL WHEN OTHERS ARE GREEDY. At 46, the Fear & Greed Index is down from 54  two weeks ago.
CLICK VIDEO FOR MORE ON THE “FEAR & GREED INDEX”
  • Bull / Bear Barometer:  NEUTRAL. This secondary market indicator should also be viewed with a contrarian perspective. As of yesterday, according to the latest survey of stock market newsletter writers by Investor’s Intelligence, the bullish tally is 50.9%, up from 47.3% two weeks ago. The bears are 20%, down from 23.6% two weeks ago. Consider this a contrarian indicator because the crowd is often wrong at market tops and bottoms. In other words, extreme bullishness has been seen near several market tops in the past, while extreme bearishness has been seen at market bottoms.
  • Put / Call Ratio: BEARISH. The ratio of put-to-call options is .61, down from 0.76 two weeks ago. The put-call ratio tracks the mood of what options investors are doing, not just saying. They typically buy puts if they think a stock will decline and calls if they think it will rise. If they’re buying lots of puts, they see the market declining. And if they’re loading up on calls, they’re generally bullish. Historically, market bottoms occurred when the reading spikes to 1.2 or more. Market tops are often made when the reading is 0.6 or less. Note how reliable this is with respect to the February record low coinciding with the market high. Keep in mind this is also a contrarian indicator.

ECONOMIC UPDATES

Global Economic Indicators & Analysis:
POSITIVE INDICATORS
Jobless Claims Down: U.S. initial jobless claims dropped to a seasonally adjusted 208,000 for the week ending July 11, according to the Labor Department. This marked a decrease of 8,000 from the previous week’s revised level of 216,000 and came in well below the median economist forecast of 217,000.
Philly Fed Up: The Philadelphia Fed Manufacturing Index climbed to 41.4 in July 2026 from 10.3 in June, largely beating market expectations of 13. The latest data pointed to a continued recovery in business conditions, with activity expanding at the fastest pace since November 2021. The current new orders index jumped 10 points to 37.0, its highest level since November 2021, while the shipments index climbed 19 points to 33.7, the strongest reading since April. The employment index edged up 2 points to 10.0, its highest level since December, and the average workweek index surged 21 points to 14.0, reaching its highest reading since January 2025.
Retail Sales Up: The monthly estimate of consumer spending was a bit softer than expected for June, but the more muted gains were largely driven by lower prices at the gas pump last month. U.S. retail sales rose 0.2% in June from May, slightly below the 0.3% increase expected by economists surveyed by FactSet. The softer retail sales growth was largely driven by falling fuel prices, with spending at gas stations down 5.3% month over month in June. Control-group sales, which exclude autos, gasoline, building materials and restaurant meals, rose 0.5% month over month in June. Many economists fear that spending may have peaked in the first half of the year, slowing during the last six months as the boost from higher average tax refunds fades and Americans are left to grapple with persistently elevated prices.
CPI Down: The Consumer Price Index decreased 0.4% on a seasonally adjusted basis in June after rising 0.5% in May, the U.S. Bureau of Labor Statistics reported Tuesday. This decline in the all items index was the largest 1-month decrease since April 2020 when it fell 0.8%. Over the last 12 months, the all items index increased 3.5%. The index for energy fell 5.7% in June after rising 3.9 percent in May, 3.8% in April, and 10.9 percent in March. The energy index was the largest contributor to the monthly all items decrease, more than offsetting increases in other indexes including those for shelter and food. The index for food increased 0.2% over the month, as did the index for food at home and the index for food away from home. The index for all items less food and energy was unchanged in June. Indexes that decreased over the month include motor vehicle insurance, communication, apparel, medical care, and used cars and trucks. Conversely, the indexes for recreation, household furnishings and operations, and personal care were among the major indexes that increased in June.
PPI Down: More good news on inflation…. The Producer Price Index for final demand fell 0.3% in June, seasonally adjusted, the U.S. Bureau of Labor Statistics reported today. Final demand prices advanced 0.6% in May and 1.1% in April. On an unadjusted basis, the index for final demand increased 5.5% for the 12 months ended in June. The June decline in the index for final demand can be attributed to prices for final demand goods, which fell 1.4%. In contrast, the index for final demand services moved up 0.2%. For the 12 months ended in June, prices for final demand less foods, energy, and trade services rose 5.1%.
US Services PMI Up: The S&P Global US Services PMI rose to 51.2 in June of 2026 from 50.7 in the previous month, revised marginally lower from the flash estimate of 51.3. Still, the result pointed to the fastest pace of expansion in the US services sector since before the outbreak of war in the Middle East triggered a global energy shock. New business grew at an accelerated pace, aided by an influx of high-spending tourists and events amid the FIFA World Cup that the US hosted during the period. Still, historically muted perceptions of business conditions dimmed the pace of hiring and the net amount of jobs decreased for the third month in the last four. Consistently, labor-related costs increased operating expenses in the period, magnifying the impact of tariffs and higher fuel prices from the war in Iran. Looking forward, firms continued to be optimistic on business output in the coming year.
NFIB Small Business Optimism Index Up: The NFIB Small Business Optimism Index rose 2.1 points in June to 97.4, nearing its 52-year average of 98.0. Expectations for better business conditions and real sales expectations improved substantially and primarily drove the rise in the Index. The Uncertainty Index fell 2 points from May to 89, remaining well above its historical average of 68. As reported in NFIB’s monthly Jobs Report, the NFIB Small Business Employment Index remained essentially flat, registering 100.2 in June. In June, a seasonally adjusted 32% of small business owners reported job openings they could not fill in June, up 3 points from May’s lowest level since May 2020.
Empire State Manufacturing Survey Up: Business activity picked up considerably in New York State in July, according to firms responding to the Empire State Manufacturing Survey. The headline general business conditions index rose ten points to 15.6. New orders and shipments increased strongly. Unfilled orders increased, delivery times continued to lengthen, and supply availability continued to worsen. Employment rose at a solid clip and the average workweek edged higher. The pace of input and selling price increases remained elevated but slowed slightly. Firms remained fairly optimistic that conditions would improve in the months ahead.

WEAK INDICATORS

Existing Home Sales Down: Existing-home sales decreased by 2.4% in June 2026. Month over month sales increased in the Northeast, and declined in the Midwest, South and West. Year over year sales rose in the Midwest, South, and West, and were flat in the Northeast. “The back-and-forth in monthly home sales activity, driven by mild fluctuations in mortgage rates, shows how sensitive home buyers are to affordability conditions,” said NAR Chief Economist Dr. Lawrence Yun. “However, job gains—more than half a million since the beginning of the year—will continue to provide support for the housing market.” Yun continued, “The median home price has reached an all-time high. Even so, affordability is better than a year ago because wage growth is outpacing home price growth. However, progress on long-term housing affordability could be hampered if inventory growth continues to stall. Without consistent gains in inventory, home prices can accelerate. It is critical to introduce more supply to the market to widen the opportunity for homeownership.”
Pending Home Sales Down: Future home sales worsened by one gauge in June. It’s another disappointment for many home builder stocks, which have been sidelined by high mortgage rates. Pending home sales—contract signings measured by the National Association of Realtors that indicate future closed existing-home sales—dropped 5.4% in June from May and was a hair lower than June of last year. The data point is another headed in the wrong direction for investors who waiting for a housing rebound after last week’s disappointing existing-home sale data.
NAHB Down: The National Association of Home Builders Index measures single-family builder sentiment on a scale of 0 to 100. In July, the index fell two points to 34, down from 36 in June. Any reading below 50 indicates negative market sentiment, driven by high mortgage rates and ongoing affordability headwinds. Many are cutting prices: 37% of builders cut prices in July, with an average reduction of 6%.