ERPE Excerpts 6.5.2025 … Sell in May?

Bi-MONTHLY MARKET ANALYSIS &

ECONOMIC UPDATES

June 5, 2025

Sell in May?

Not this May! Or last May. The SP 500 just turned the page to a new month, scoring a remarkable gain in May of 6.15%. It jumped 4.8% May of last year. This May was the the second best month of May for the SP 500 since 1950. The best May was 1990 when it flew higher by 9.2%. And, last May’s gain was just the 10th time the SP 500 gained greater than 4% in the month of May since 1950. So, May’s have been great months for stocks. Sure looks like it. Well, less great when we stretch the performance for the SP 500 in the month of May over its long history. After all, there has to be a reason for the stock market adage, “Sell in May and go away”. The phrase gained popularity in the 1970s-1980s, especially through media commentary and investment advisory circles (the incubator for most catchy stock market sayings you’ve probably heard). That, though, is only half of the Wall Street sage. It finishes with, “Come back in November.” Since I remember those days in the market in the ’80’s, back then I made up my own version, “Sell in May and go away, but remember November to buy back”. Though the stock market adage’s origin was based on seasonal market pattern observations, it may not have been a foundational stock investment strategy for many. Here’s a few more historical stats on stocks in May and perhaps the thinking behind the adage.

“Sell in May and go away” gained momentum with what the Stock Trader’s Almanac calls the “The best six months” and “The worst six months”. Its’ historical data showed that the top performing 6-month rolling period since 1950, on average, was November through April. The “worst six” were May through October. So, they said, investors should “sell in May and go away”—and “come back in November.” The “strategy” supported by the Stock Trader’s Almanac simply bought the Dow Jones Industrial Average November 1st and held to April 30th each year. It then switched into fixed income investments by selling the stock index and buying bonds May 1 and holding to the end of October. The research shows from 1950 through 2023 the Dow gained on average 7.4% between November 1 and April 30, vs. only 0.8% during May 1 to October 31 over the same period. Separate research reveals that since 1990, the S&P 500 has averaged a return of about 3% annually from May to October versus about 6% from November to April. So, the pattern persists. Why? In a word, “seasonality”. Here’s more on a combination of stock market patterns and factors resulting in market seasonality.

  • Institutional and Investor Behavior:

Year-End and Tax Strategies – Many investors, mutual funds, and institutions make portfolio adjustments at year-end or early in the new year, which can lead to increased trading activity and upward market movements during the November-April period. “Tax-loss harvesting” (Tax-Loss Selling) strategies and portfolio rebalancing often occur late in the year, boosting market performance towards year-end and early the next year.

  • Corporate Earnings Cycles:

Earnings Season – The fourth quarter (October–December) and the start of the new year often bring strong corporate earnings reports, which can drive market gains through optimism about future growth.

Seasonal Growth – Many companies report their most significant earnings or guidance updates during these months, boosting investor confidence. Regardless of quarter, “earnings season” adds to market volatility each quarter.

  • Reduced Market Volatility:

Summer Lull – During the May-October period, trading volumes often decline due to vacations and reduced institutional activity, which can lead to lower returns and sometimes increased volatility.

Lower Participation – Smaller trading volumes can sometimes suppress market gains, as fewer investors are actively buying, and market moves may be more influenced by short-term traders or algorithmic activity.

  • Market Psychology, Sentiment and Year-end Planning:

Investor Optimism at Year-End – Positive sentiment around the holidays and new year often encourages buying. Often at year end and new year beginning retirement savings accounts see increased contributions leading to additional investments.

Holiday Effect – The holiday season (Thanksgiving to New Year) can boost markets due to increased consumer spending and optimism.

End-of-Year Rally (“Santa Claus Rally”) – Historically, markets tend to rise in the last week of December through the first two trading days of January, contributing to potential higher gains during the November-April period.

While these patterns have held in the past, they do may not repeat or have the same impact on the market, especially as markets evolve and global economic dynamics shift. While seasonal occurrences may occasionally align with market trends, they are not reliable predictors of future performance. The strong May 2025 market performance underscores the importance of a disciplined, fundamental-driven approach rather than reactive seasonal moves. Clearly the “Sell in May” decision was a costly one this year (and last). I say a lot, “We have heard it before, now it’s time to listen”. In that spirit, investors should focus on diversified, long-term strategies aligned with their financial goals, rather than relying on adages hopefully have special predictive power.

TAKING PERSPECTIVE…

Proper Perspective:  In our hectic and often hard to comprehend world, it is very easy to lose perspective. You may agree it is sometimes difficult to see the big picture. The media often doesn’t help with this, but unfortunately instead encourages us to see things in a most negative light. Here is hopefully a pause to gain positive perspective.

Famous Quote On This Day:  “The real hero is the man who fights even though he is scared.”

~~ George S. Patton, 1944

What Happened On this Day June 5, 1876 –  Bananas first became popular in US after being introduced at the Centennial Exposition in Philadelphia.

MARKET ANALYSIS

INDICATORS OF INTEREST:

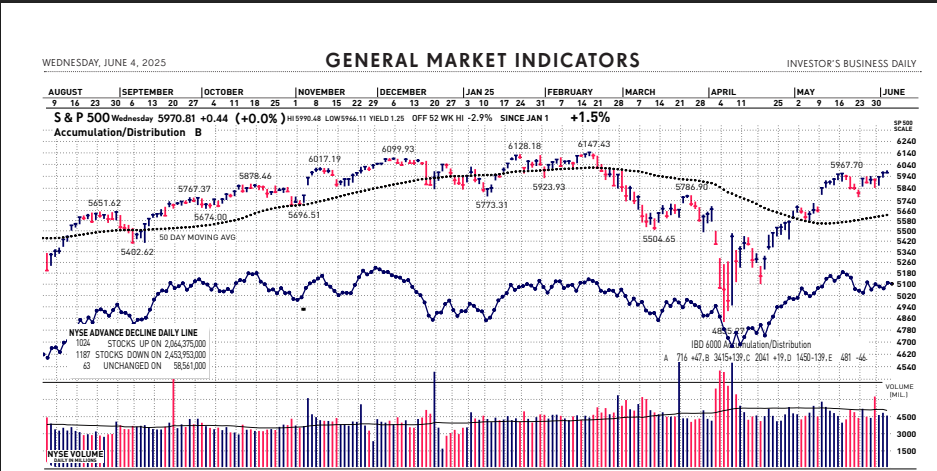
  • Market’s Current Signal: Confirmed Uptrend.  Analysis of the stock market over 130 years of history shows we can view it in terms of three stages -market in uptrend, uptrend under pressure and market correction.  Since the 1880’s, this perspective has led to investment out-performance relative to market indexes. This is due to trend analysis which determines risk reducing, return enhancing market entry and exit points. The U.S. stock market’s current signal indicates the market is in Confirmed Uptrend. That officially happened April 22.

The Stock Market Trend: Confirmed Uptrend. The stock market powered higher Tuesday, April 22 and the Nasdaq and S&P 500 confirmed new rally attempts. This follow-through signaled a Confirmed Uptrend. Last week the major stock market indexes reclaimed levels set in late February and significantly above the pre-“Liberation Day” prices. As I note below, the major indices are now near or above the level at 2024’s end.

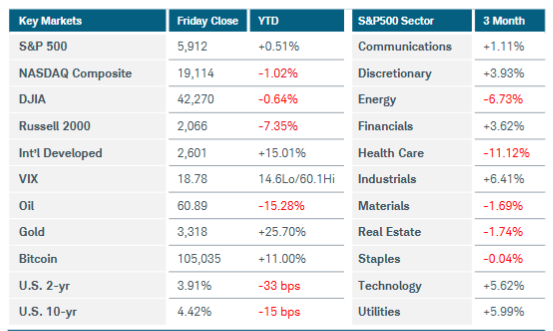
Here are key market levels as of Monday, June 2

Recapping Last Week

U.S. equity indices posted strong returns for the month of May, but gains in the shortened last week were held in check after more tariff uncertainty emerged. The S&P500, Nasdaq Composite, and Russell 2000 indices rose 2% or less for the week. Ten of eleven S&P500 sectors were positive, led by real estate and healthcare. Energy was the lone decliner, pressured by sliding crude oil prices as OPEC+ was said to be considering more production increases. Gold futures slipped 1% while Bitcoin dropped 3%. U.S. Treasury yields eased as investors sorted through the latest barrage of tariff-related news. Late on Wednesday, a U.S. trade court ruling blocked most of the tariffs initiated this year, not including sector-specific levies. However, the following day a federal appeals court paused the lower court ruling to consider the government’s request for review. Meanwhile, the White House accused China of violating the recently reached agreement on tariffs, and Treasury Secretary Bessent said that trade talks between the countries were “a bit stalled.” The involvement of the courts along with tensions between the two largest global economies add new wrinkles to an already complex and seemingly fragile situation. Economic data was generally positive last week with sentiment indicators improving. Consumer confidence jumped to 98.0 in May—a 12-point increase from the prior reading—while the consumer sentiment index edged up to 52.2 from 50.8, and inflation expectations eased slightly. The headline PCE price index fell to 2.1% YoY and the core measure slowed to 2.5%, in line with forecasts. The second estimate of Q1 GDP showed a slightly smaller contraction at -0.2%, while the U.S. goods trade deficit narrowed sharply in April as the boost from tariff front-running faded. Minutes from the last FOMC meeting revealed “difficult tradeoffs” faced by the committee if inflation and unemployment start to rise in tandem. Finally, chip giant Nvidia jumped more than 9% before pulling back, after posting first-quarter results that exceeded expectations despite challenges related to China export rules. Artificial intelligence continues to attract substantial investment, which should be seen as a tailwind to growth sectors of the markets.

Overseas, Japan considered trimming issuance of super-long bonds in response to the recent rise in yields. A weak auction on Wednesday raised concerns of dwindling demand from bond investors in the heavily indebted country. Expectations for a Bank of Japan rate hike in July ramped up after two key core inflation readings accelerated. In Europe, Germany’s CPI held steady at 2.1% YoY in May, while consumer sentiment rose for a third straight month. European Central Bank President Lagarde said that erratic U.S. economic policies could present an opportunity for the euro to take on a larger global role but not without improvements in capital market structure and legal foundations.

Current View

President Donald Trump’s order to double tariffs on steel products coming into the U.S. to 50% from 25% went into effect yesterday. The market, as has become a pattern recently, opened weak but gained strength into the close. At 19,460, the Nasdaq composite was up 0.8% for the year, yesterday. At one point, though, the tech-heavy index had fallen 23.4% since the start of January. The S&P 500 has followed a similar course. Another seasonality factor, especially for tech stocks, is quickly approaching. Specifically, they tend to post sizeable rallies in the second half of the year.

The SP 500 closed 2024 at 6,040. It closed yesterday at 5,970. Down only 70 points, just a little over 1%, is remarkable considering at its low on April 7 it was 4,835. That was a 20% drop from the first of the year. Math is funny sometimes… after a 20% loss, it takes a 25% to get back to even.

  • Industry Group Strength:  BEARISH. As of yesterday, 79 out the 197 groups I monitor are up year-to-date. 118 groups are down for the year.
  • New Highs vs. New Lows:  BULLISH. In yesterday’s session, there were 97 new 52-week highs and 56 new 52-week lows.
  • Dow Dividend Yield:  BEARISH. The current yield for the Dow Jones Industrial Average is 1.91%. The 10-year Treasury now 4.39%.
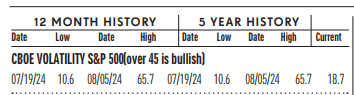
  • Volatility Index: EUTRAL. Volatility has been volatile. The “VIX” is now about 18, down from 19 as two weeks ago. The index is also known as the “Fear Index.” It is considered a contrarian indicator and therefore viewed as bullish as it rises indicating investors are becoming more fearful. The VIX:
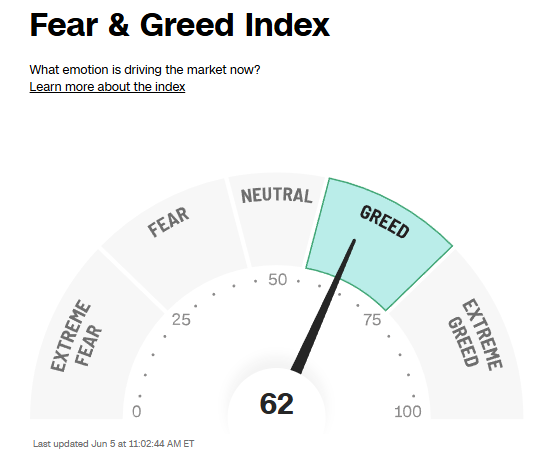
  • Fear / Greed Index: BEARISH.  Investors are driven by two emotions: fear and greed. Too much fear can create a condition of oversold/ undervalued stock prices. Too much greed can result in overbought/overvalued stock prices. The AAII Investor Sentiment Index is now neutral.   BE FEARFUL WHEN OTHERS ARE GREEDY. At 62, the Fear & Greed Index is donw from 66 two weeks ago. Remember, the index was at 3 a 6 weeks ago!

CLICK VIDEO FOR MORE ON THE “FEAR & GREED INDEX”

How CNNMoney’s Fear & Greed Index works

  • Bull / Bear Barometer:  BULLISH. This secondary market indicator should also be viewed with a contrarian perspective. As of yesterday, according to the latest survey of stock market newsletter writers by Investor’s Intelligence, the bullish tally is 37.7% down from 42.3% 2 weeks ago. The bears are 26.4%, down from 26.9% 2 weeks ago. Consider this a contrarian indicator because the crowd is often wrong at market tops and bottoms. In other words, extreme bullishness has been seen near several market tops in the past, while extreme bearishness has been seen at market bottoms.
  • Put / Call Ratio: BEARISH. The ratio of put-to-call options is 0.56, down from 0.71 2 weeks ago. The put-call ratio tracks the mood of what options investors are doing, not just saying. They typically buy puts if they think a stock will decline and calls if they think it will rise. If they’re buying lots of puts, they see the market declining. And if they’re loading up on calls, they’re generally bullish. Historically, market bottoms occurred when the reading spikes to 1.2 or more. Market tops are often made when the reading is 0.6 or less. Note how reliable this is with respect to the February record low coinciding with the market high. Keep in mind this is also a contrarian indicator.

ECONOMIC UPDATES

Global Economic Indicators & Analysis:

POSITIVE INDICATORS

Consumer Confidence Up: The consumer confidence index jumped to 98 in May from a revised 85.7 in the prior month, the Conference Board said Tuesday. This is the first gain after five straight months of decline. Economists polled by the Wall Street Journal had forecast the index to hold steady at 86 in April, which was the lowest level since the pandemic. Confidence improved after U.S.-China trade talks in mid-May resulted in a truce, the Conference Board said. A measure that looks at how consumers feel about the economy right now rose 4.8 points to 135.9. A confidence gauge that looks six months ahead surged 17.4 points to 72.8 in May. The subindex has been especially weak.

Consumer Spending Up – mildly: Americans became more cautious spenders in April after the Trump administration jacked up U.S. tariffs and the stock market plunged. Now the big question is what they will do next as the trade wars die down. Personal spending rose a modest 0.2% last month, the government said last Friday, matching the forecast of economists polled by The Wall Street Journal. Households boosted spending in March, especially on cars, to avoid tariff-related price increases. They cut back last month as the tariffs started to kick in. Still, even the current level of consumer spending is enough to keep the economy plowing ahead, especially with strong income growth. What could also help is a recent relaxation of U.S. tariffs and now some court rulings that could kill off many of the duties entirely. As the court decisions are being appealed, uncertainty is likely to linger.

U.S. Trade Deficit Down: The U.S. goods deficit narrowed very sharply in April as foreign orders ground to a halt after President Donald Trump announced sweeping, higher tariffs. The trade deficit in goods narrowed by 46% to $87.6 billion in April from a record $162.3 billion in March, according to the Commerce Department’s advanced estimate released last Friday. That’s the narrowest trade gap since December 2023. After stockpiling consumer goods in the first quarter to avoid the then-anticipated tariffs, businesses essentially stopped importing goods in April. The deficit was much narrower than the $143 billion deficit forecast by economists, according to an Econoday Inc. survey. Falling imports will likely boost GDP growth in the second quarter. Imports dropped a record 19.8% in April after a 5.7% jump in March.

Inflation Gauge Down to 5-year low: The cost of living barely rose in April — and the rate of inflation slowed even closer to pre-pandemic levels — but it’s unclear whether the recent progress can be sustained as the trade wars drag on. The PCE index, the Fed’s preferred inflation gauge, rose a scant 0.1% last month, the Bureau of Economic Analysis said Friday. Inflation was flat in April. The back-to-back monthly inflation readings were the softest since the pandemic in 2020. The 12-month rate of inflation, meanwhile, slowed to 2.1% from 2.3% and also matched the lowest level since the pandemic. The rate of inflation had touched 2.1% last September before backing up again. The U.S. central bank is aiming to reduce the annual inflation rate to 2% in the long run and the Fed is not far off its mark. Yet top Fed officials and many Wall Street economists think prices could rise a bit faster over the summer as the effects of the tariffs filter through the economy. What could help keep inflation in check was a recent White House relaxation of tariffs and a pair of court decisions this week ruling the president did not have the authority to impose most of the duties. The legal battles could take time to play out, however, and the White House could seek other avenues to raise tariffs. If energy and food are omitted, the so-called core rate of inflation also rose just 0.1% last month. That was another good sign. The yearly rate of core inflation decelerated to 2.5% from 2.6%. That’s the lowest since early 2021.

WEAK INDICATORS

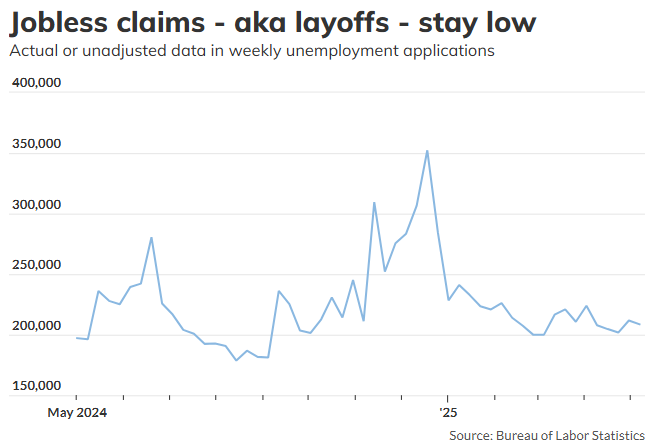
Jobless Claims Up:  The number of people who applied for unemployment benefits last week jumped to an eight-month high, but the details of the government’s report show little evidence of a tariff-related rise in layoffs. Initial jobless claims rose by 8,000 to 247,000 in the seven days ended May 31 based on seasonally adjusted data, the government said today. It was the highest tally since last October. Still, though, claims remain relatively low.

JOLT’s Up: Job openings in the U.S. rose in April even after President Donald Trump jacked up tariffs on the rest of the world, but companies were slow to fill new positions amid the worst trade wars since the 1930s. New job postings rose to 7.4 million at the end of April from 7.2 million in the prior month, the government said last Tuesday. They are down almost 40% from a record high three years ago, however. The rate of hiring, meanwhile, remained close to a post-pandemic low. Other surveys show it’s taking longer for people who lose one job to find another, and that work has become harder to find. Businesses leaders say it’s difficult to hire and invest until the trade wars fade and it becomes clear what level of tariffs the White House will settle upon. But companies are still selectively adding employees where they are needed. The president relaxed most tariffs in the past month to allow for negotiations, and that could help, but he could still reimpose them if the U.S. and other countries fail to reach new agreements.

U.S. Productivity Down: U.S. worker productivity dropped at a faster pace than initially thought in the first quarter, driving labor costs sharply higher at a time when businesses are already facing rising costs from tariffs on imported goods. Nonfarm productivity, which measures hourly output per worker, decreased at a 1.5% annualized rate last quarter, the Labor Department’s Bureau of Labor Statistics said today. That was revised down from the previously reported 0.8% pace of decline and marked the first drop since the second quarter of 2022. Economists polled by Reuters had forecast the decline in productivity would be unrevised at a 0.8% rate. Productivity increased at an unrevised 1.7% rate in the October-December quarter. It grew at a 1.3% rate from a year ago, revised down from the 1.4% pace estimated last month.

Manufacturing Down:  American manufacturers suffered the biggest decline in imports in May in 16 years after President Trump briefly jacked up tariffs to punishing levels — and even the relaxation of high duties has done little to ease the stress. The manufacturing index of the Institute for Supply Management released Monday fell slightly in May to a six-month low of 48.5%. Any number below 50% signals contraction. Imports sank to a 16-year low and exports dropped to a five-year low. Senior manufacturing executives say the industry will only improve when the ongoing trade wars are resolved and they know what level of tariffs the White House will ultimately settle upon. “Tariff whiplash continues while the easing of tariff rates between the U.S. and China in May was welcome news, the question is what happens in 90 days,” when the temporary tariff reductions end, a senior manufacturing executive told ISM.

GDP Down:  The contraction in the economy in the first three months of 2025 was slightly smaller than originally reported, a government update showed last Thursday, but the underlying message was the same: Ongoing trade disputes are hampering U.S. growth. Gross domestic product fell at an annual rate of 0.2% in the first quarter instead of 0.3% as originally reported, the Bureau of Economic Analysis said last Thursday. GDP is the official scorecard of the economy. The economy officially shrank for the first time in three years because of a surge in imports that pushed the trade deficit to record highs. Trade deficits subtract from GDP. Slower consumer spending was another factor. The economy appears poised to rebound in the second quarter after Trump relaxed the highest tariffs to allow for negotiations. Once he dialed back his threats, the stock market recovered and consumer confidence rose.

Call me if you have any questions. I am always happy to help!

John J. Gardner, CFP®, CPM®.

Blackhawk Wealth Advisors, Inc.

3860 Blackhawk Rd. Ste. 160 Danville, CA. 94506

Phone: 888-985-PLAN · Email: jg@blackhawkwealthadvisors.com

BLACKHAWKWEALTHADVISORS.COM

For my Market Monthly podcast, click on the link below. I provide a review of global stock market highlights over past month and preview of the month ahead. Forward insights and perspectives are based on current financial market and economic trends with an emphasis on relevant developments in various areas from Fed policy to company earnings announcements.

810c9060-6bc9-4e20-948f-60bee7c1b0be image
dc6d6594-dfce-48b0-8d69-3a27db12748d image
7d2eabf6-51c8-425f-b667-128ed7bc0dd2 image

Blackhawk Wealth Advisors is the parent corporation of Equity Research & Portfolio Evaluation and Blackhawk Asset Management. It’s Chief Investment Officer is John J. Gardner. John is a Certified Financial Planner (CFP®) and Certified Portfolio Manager (CPM®). As an AIF®, John is also an Accredited Investment Fiduciary.

CUSTOMIZED. STRATEGIC. DYNAMIC.