ERPE Excerpts 4.10.25 Bear Market Bounce

Bi-MONTHLY MARKET ANALYSIS &

ECONOMIC UPDATES

April 10, 2025

Bear Market Bounce

Extreme single best day historical gains in the stock market, like yesterday, have happened during the worst market conditions. Call them a bear market bounce. In a note to clients yesterday, I put in perspective that the Nasdaq’s extraordinary jump of over 12% was the second best day on record. The chart above of the SP 500 index is a short-term view showing yesterday’s near 10% incredible increase (blue vertical line) and all the red lines (down days) surrounding it. Including today. Already this morning the SP 500 is down over 4%, giving back much of yesterday’s gain. It has been historically normal for the indexes to fall back in the day after and ensuing days after these super spike bear market bounces. Two main takeaways from these extreme moves are, one, they occur generally after measurably oversold conditions and a collapse in investor sentiment, and, two, they trigger the start of the market’s bottoming process.

Look at tables below. First the Nasdaq, which only dates back to 1971. Then the Dow, America’s oldest stock market index. The top 10 greatest gains came during the market’s worst times: The Great Depression, Black Monday ’87, The Dot Com Bust, The Great Financial Crisis (GFC 2007-09), and in recent history, the Covid-19 Pandemic. The country’s and world’s worst of times!

So, days in the stock market like yesterday are bear market bounces and often called “relief rallies”. While those awesome moves higher feel fantastic, they historically don’t signal an all clear end to more moves lower. Today’s market action shows that. Volatility remains elevated and investor FUD (Fear Uncertainty & Doubt) are still high. Bear market bounces are a bullish part of the bear market’s bottoming. The vintage Rolaids commercials asked, “How do you spell relief?” Wall Street’s relief comes in the form of giant gains like yesterday. Some investors may be reaching for Rolaids while the bear market bottoming process plays out.

TAKING PERSPECTIVE…

Proper Perspective:  In our hectic and often hard to comprehend world, it is very easy to lose perspective. You may agree it is sometimes difficult to see the big picture. The media often doesn’t help with this, but unfortunately instead encourages us to see things in a most negative light. Here is hopefully a pause to gain positive perspective.

Famous Quote On This Day:  “Personal differences, business differences, musical differences, but most of all because I have a better time with my family. (On split with Beatles)”

~~ Paul McCartney, 1970

What Happened On this Day April 10, 1960 – Senate passes landmark Civil Rights Bill.

MARKET ANALYSIS

INDICATORS OF INTEREST:

  • Market’s Current Signal: Market in Correction.  Analysis of the stock market over 130 years of history shows we can view it in terms of three stages -market in uptrend, uptrend under pressure and market correction.  Since the 1880’s, this perspective has led to investment out-performance relative to market indexes. This is due to trend analysis which determines risk reducing, return enhancing market entry and exit points. The U.S. stock market’s current signal indicates the market is in correction mode. That officially happened March 13.

The Stock Market Trend: Market in Correction. Just days after the major market indexes closed at new all-time record highs on February 19, the market’s trend signal weakened from Confirmed Uptrend to Uptrend Under Pressure the 21st and reiterated on the 24th. The next weaker signal would be Market in Correction. That would be a 10% drop from the high made February 19. That happened. All recent rally attempts have failed. Bullish market action yesterday, the 2nd best day in history for the Nasdaq up over 12%, has failed for now. A “confirmed rally” with a follow-through day is necessary to change the market’s trend signal.

Here are key market levels as of Monday, April 10.

Recapping Last Week

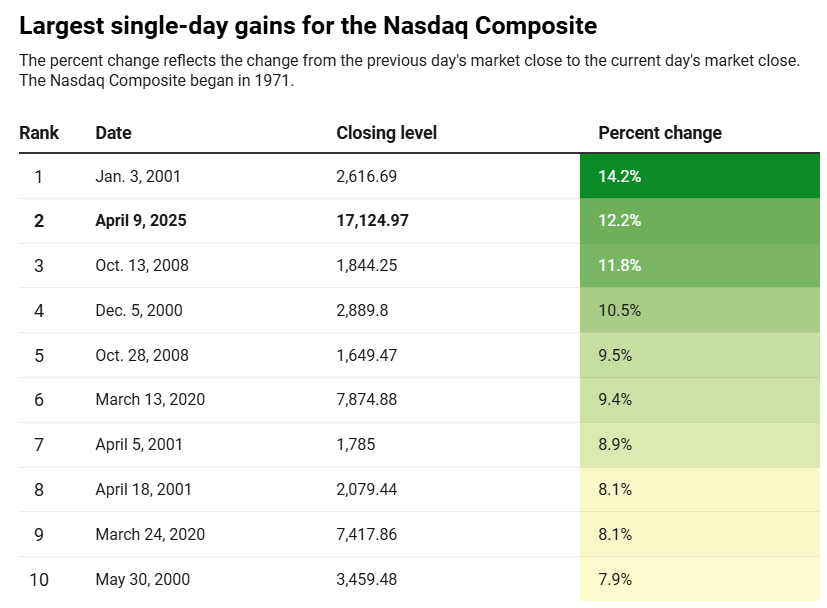
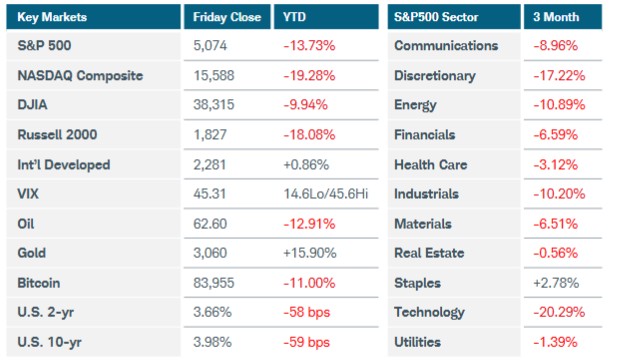
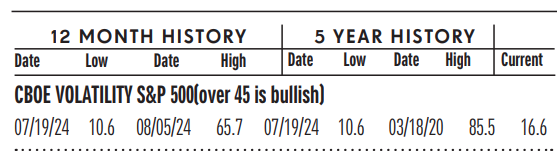
Risk assets plunged around the globe as larger than expected tariffs imposed by the U.S. along with retaliations by major trading partners such as China stoked recession fears. After a modest rally to begin the week, the S&P500 index tumbled nearly 5% on Thursday and another 6% on Friday, finishing 9% lower overall. The Nasdaq Composite sank 10% as technology stocks were hammered, while the Russell 2000 also lost 10%. The Cboe volatility index soared above 45—a level not seen since August—implying an expected daily move greater then 2.8% for the S&P500 index. Crude oil prices plummeted more than 9%, dragged down by fears of a global trade war along with OPEC’s surprising decision to increase oil output by a higher-than-expected 411,000 barrels per day starting next month. Investors flocked to the safe-haven of fixed income investments, sending the 10-year U.S. Treasury yield below 4% for the first time since October. The U.S. dollar fell sharply against other global currencies, reflecting concerns that a trade war could impact domestic growth more than other economies. In a speech Friday, Fed Chair Powell said he expects tariffs to raise inflation and slow economic growth, but indicated the FOMC won’t move on interest rates until the impacts are clearer. Turning to other economic news, U.S. job growth was stronger than expected in March, providing at least a temporary reprieve from the flood of negative data. Nonfarm payrolls increased by 228,000 with the unemployment rate ticking up only slightly to 4.2%. Layoffs surged last month and in the first quarter according to the Challenger report but have not shown up in the official labor market data as court cases contesting the firings are pending. The ISM manufacturing PMI slipped into contraction for the first time this year, registering a 49.0 reading in March. The prices paid index jumped to the highest level in nearly three years, and survey participants indicated much uncertainty. Growth in the services sector stalled as the ISM’s measure of employment contracted for the first time in six months.

In international markets, Europe and other developed markets gave up most of their gains for the year. The MSCI EAFE index sank more than 7% as the realities of a potential trade war set in. Inflation in the Eurozone edged lower in March, lifting expectations for another rate cut at the next central bank meeting later this month. The Reserve Bank of Australia opted to keep interest rates unchanged and wait for upcoming inflation and labor market data before committing to future rate cuts. Finally, China’s manufacturing and services sector activity showed promise last month, according to the official government and Caixin PMI surveys. Rising trends in new orders and employment may have represented temporary lifts ahead of last week’s tariff news.

Current View

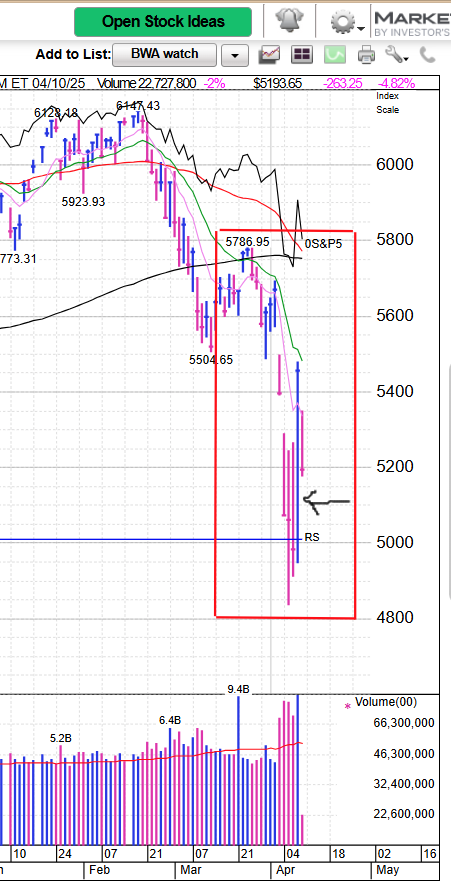
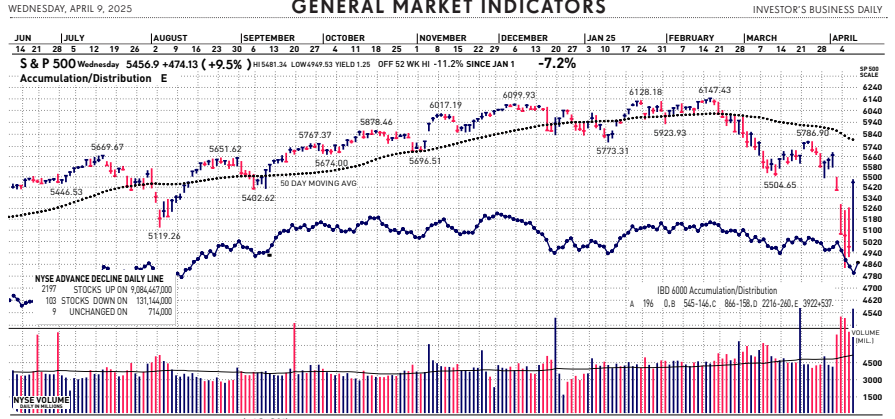
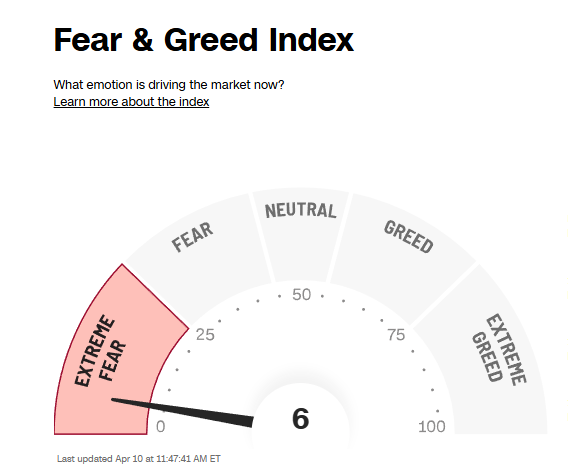
At the end of last week’s collapse in U.S. equity markets, some signs of capitulation emerged. Friday’s decline was among the worst breadth days in the last 60 years, registering a Major Distribution Day in terms of both declining issues and volume. From a technical perspective, the Nasdaq-100 index experienced a drop of more than 20% from the February 19 high to Friday’s low. Those were reliable indications that the general stock market was due for a bounce. Tariff talks are on-going, including as I write today’s ERPE Excerpts. So, extreme volatility and investor uncertainty remain. Sellers came out in force and pounded stock indexes today after it was reported President Donald Trump said new tariff rates on Chinese goods would climb higher than expected. Even tame inflation news couldn’t stop selling so far today. Volume jumped 35% above average. Decliners are outpacing advancers 9-to-1.  The macro market is near bear market levels.

  • Industry Group Strength:  BEARISH. As of yesterday, 53 out the 197 groups I monitor are up year-to-date. 144 groups are down for the year.
  • New Highs vs. New Lows:  BEARISH. In yesterday’s session, there were 30 new 52-week highs and 1169 new 52-week lows.
  • Dow Dividend Yield:  BEARISH. The current yield for the Dow Jones Industrial Average is 2.1%. The 10-year Treasury now 4.37%.
  • Volatility Index:  BULLISH. Volatility has been volatile. The “VIX” is now 45, up from 19 as two weeks ago. The index is also known as the “Fear Index.” It is considered a contrarian indicator and therefore viewed as bullish as it rises indicating investors are becoming more fearful. The VIX:
  • Fear / Greed Index: BULLISH.  Investors are driven by two emotions: fear and greed. Too much fear can create a condition of oversold/ undervalued stock prices. Too much greed can result in overbought/overvalued stock prices. The AAII Investor Sentiment Index is now neutral.   BE FEARFUL WHEN OTHERS ARE GREEDY. At 6, the Fear & Greed Index is down from 30 two weeks ago.

CLICK VIDEO FOR MORE ON THE “FEAR & GREED INDEX”

How CNNMoney’s Fear & Greed Index works

  • Bull / Bear Barometer:  BULLISH. This secondary market indicator should also be viewed with a contrarian perspective. As of yesterday, according to the latest survey of stock market newsletter writers by Investor’s Intelligence, the bullish tally is 23.6% down from 30.5% 2 weeks ago. The bears are 34.6%, up from 28.8% 2 weeks ago. Consider this a contrarian indicator because the crowd is often wrong at market tops and bottoms. In other words, extreme bullishness has been seen near several market tops in the past, while extreme bearishness has been seen at market bottoms.
  • Put / Call Ratio:  BULLISH. The ratio of put-to-call options is 1.28, up from .96 2 weeks ago. The put-call ratio tracks the mood of what options investors are doing, not just saying. They typically buy puts if they think a stock will decline and calls if they think it will rise. If they’re buying lots of puts, they see the market declining. And if they’re loading up on calls, they’re generally bullish. Historically, market bottoms occurred when the reading spikes to 1.2 or more. Market tops are often made when the reading is 0.6 or less. Note how reliable this is with respect to the February record low coinciding with the market high. Keep in mind this is also a contrarian indicator.

ECONOMIC UPDATES

Global Economic Indicators & Analysis:

POSITIVE INDICATORS

CPI Down:   Consumer prices fell in March for the first time since the outbreak of the coronavirus pandemic in 2020, but economists warn inflation could get worse if the U.S. retains higher tariffs on China and the rest of the world. The consumer-price index declined 0.1% last month, the Bureau of Labor Statistics said today, aided by falling oil prices and lower airfares. It was the first drop since May 2020. The 12-month increase in consumer prices slowed to 2.4% from 2.8%, matching a post-pandemic low. Normally such a muted CPI report would have come as a huge relief to Wall Street and possibly paved the way for the Federal Reserve to cut interest rates. Gasoline prices sank 6.3% last month and mostly explained the decline in overall consumer prices, a big catalyst to the cooling of inflation.

Jobs Market Up:  The U.S. added a bigger-than-expected 228,000 jobs in March. Good news to be sure, but that was before President Trump unveiled norm-shattering tariffs on the rest of the world, the repercussions of which are yet to be felt on the labor market. Economists polled by the Wall Street Journal had forecast an increase of 140,000 new jobs in March vs a revised 117,000 gain in February. The increase in hiring was concentrated in companies that tend to see pickup in business when the weather warms. Unusually cold weather in the first two months of the year depressed employment. The unemployment rate, meanwhile, moved up to 4.2% from 4.1%, matching the highest rate in five months. The latest snapshot of the labor market was taken before Trump announced the biggest U.S. tariffs since the Great Depression in the 1930s. The president last Wednesday stunned Wall Street — and the world — with the size of the punitive duties. Economists warn the tariffs, if kept in place, could slow the economy, depress hiring and spark higher inflation.

PMI Up, barely:  US manufacturing sector growth stalled in March. Having grown strongly in February, production declined as order books expanded only modestly despite evidence of a stabilization of exports. Confidence in the outlook for business activity softened, amid some uncertainty over the impact of federal government policies. Employment numbers were unchanged after four months of job gains. Softer trends in output and new orders, plus uncertainty in the outlook, weighed on hiring decisions. Cost pressures intensified, largely due to the impact of tariffs, with input price inflation rising to its highest level in over two-and a-half years. The seasonally adjusted S&P Global US Manufacturing Purchasing Managers’ Index remained above the crucial 50.0 no-change mark for a third successive month in March, but only just. Recording 50.2, down from 52.7, the PMI signaled a marginal improvement in operating conditions that was the weakest of the year so far.

Trade Deficit Down: The U.S. international trade deficit narrowed 6.1% in February to $122.7 billion after hitting a record high in the prior month, the Commerce Department said last week. The deficit is slightly less than the $123.4 billion trade gap forecast by economists surveyed by the Wall Street Journal. The deficit has increased 86% year over year, with imports increasing 21.4% and exports adding just 4.6%. Imports have surged since November. Imports of goods and services were about unchanged at $401.1 billion in February, up from $351.8 billion four months ago. Economists attribute the jump to businesses seeking to get ahead of the White House’s plans for higher tariffs, which were announced last Wednesday. Big picture: The wider trade gap in the last two months is going to take a huge bite out of first-quarter GDP. Imports are subtracted from economic growth. Carl Weinberg, chief economist at High Frequency Economics, estimated that the deficit will reduce GDP growth by 1.8 percentage points.

WEAK INDICATORS

Manufacturing Down:  U.S. manufacturers appear to have fallen back into a slump as they face rising prices and lower demand because of President Donald Trump’s new tariffs on metals and pending levies on other foreign goods. The manufacturing index of the Institute for Supply Management dropped to 49% in March from 50.3% in the prior month. Any number below 50% signals contraction. The index had posted two straight positive readings and even hit a 27-month high until the president began implementing large tariffs. Companies had been anticipating a business-friendly White House that pursued tax cuts and deregulation. Instead, they face higher short-term costs and possibly the loss of sales if countries retaliate against U.S.-made goods. Take prices: Another index that measures the cost of supplies jumped to a 2½-year high. The so-called prices-paid index surged 7 points in March to 69.4%. Just five months ago, the price gauge stood at a relatively normal 50.3%. Exports could also take a big hit once other countries respond.

NFIB Down: The NFIB Small Business Optimism Index declined by 3.3 points in March to 97.4, falling just below the 51-year average of 98. The Uncertainty Index decreased eight points from February’s second highest reading to 96. “The implementation of new policy priorities has heightened the level of uncertainty among small business owners over the past few months.” said NFIB Chief Economist Bill Dunkelberg. “Small business owners have scaled back expectations on sales growth as they better understand how these rearrangements might impact them.” Reported in NFIB’s monthly jobs report, a seasonally adjusted 40% of all small business owners reported job openings they could not fill in March, up two points from February. Of the 53% of owners hiring or trying to hire in March, 87% reported few or no qualified applicants for the positions they were trying to fill. A seasonally adjusted net 12% of owners plan to create new jobs in the next three months, down three points from February.

Call me if you have any questions. I am always happy to help!

John J. Gardner, CFP®, CPM®.

Blackhawk Wealth Advisors, Inc.

3860 Blackhawk Rd. Ste. 160 Danville, CA. 94506

Phone: 888-985-PLAN · Email: jg@blackhawkwealthadvisors.com

BLACKHAWKWEALTHADVISORS.COM

For my Market Monthly podcast, click on the link below. I provide a review of global stock market highlights over past month and preview of the month ahead. Forward insights and perspectives are based on current financial market and economic trends with an emphasis on relevant developments in various areas from Fed policy to company earnings announcements.

810c9060-6bc9-4e20-948f-60bee7c1b0be image
dc6d6594-dfce-48b0-8d69-3a27db12748d image
7d2eabf6-51c8-425f-b667-128ed7bc0dd2 image

Blackhawk Wealth Advisors is the parent corporation of Equity Research & Portfolio Evaluation and Blackhawk Asset Management. It’s Chief Investment Officer is John J. Gardner. John is a Certified Financial Planner (CFP®) and Certified Portfolio Manager (CPM®). As an AIF®, John is also an Accredited Investment Fiduciary.

CUSTOMIZED. STRATEGIC. DYNAMIC.