ERPE Excerpts 10.23.2025 Circular Spending in AI

Bi-MONTHLY MARKET ANALYSIS &

ECONOMIC UPDATES

October 23, 2025

Circular Spending in AI

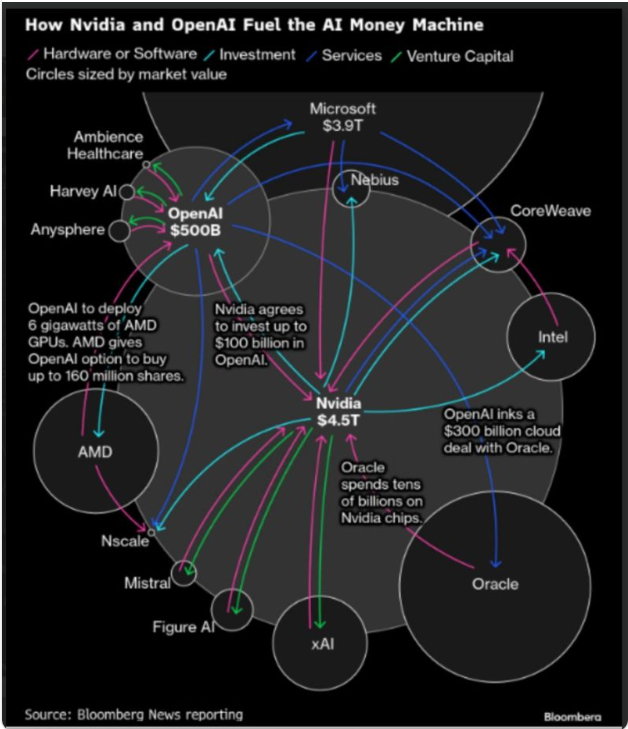
The term “circular spending” can refer to two very different concepts: a potentially misleading and problematic financing technique in the business world, or a macroeconomic model for how money flows through an economy. This term has been brought up a lot lately – with reference to its less-than-positive version. Recently, discussions of “circular spending” have caught my attention nearly daily is they relate to veritable frenzy of spending in AI. Investments over the last couple of years is measured in hundreds of billions of dollars in private and government funding, with corporate spending and committed capital for infrastructure driving the total expenditure well into the trillions over the near future. The last two years represent an inflection point where AI has become the dominant destination for tech investment globally. Global AI spending is projected to approach $1.5 trillion in 2025 and maybe $2 trillion by 2026. This includes enterprise spending on AI services, software, and infrastructure. Here is a simple idea of how “circular spending” works in a potentially unsustainable way between two companies: Company A invests money in Company B. Company B then uses that money to buy products or services from Company A. This “round trip” of cash makes it appear that both companies have healthy, growing businesses, but it is not based on real demand or outside customer spending. I thought of a kid setting up a business with a neighborhood lemonade stand. The kid gives his friend money to buy a cup of lemonade. The friend “buys” the lemonade and the entrepreneur kid calls that money received a “profit”. The graphic above shows the flow of big money between AI related companies. Note the round trip flows out of and into Nvidia. I call this “boomerang bucks”.

This business-to-business practice was a hallmark of the dot-com bubble of the late 1990’s and early 2000, where telecom companies and internet startups inflated revenue figures by buying services from one another. When the bubble burst, many of these companies collapsed. That memory has many old Wall Streeter’s, like me, a bit concerned. Of course, one can also hear today that, “It is different this time.” The fact is there have recently been major investments by tech companies in AI startups, with the startups in turn purchasing a large amount of hardware from their investors. Different? We won’t know how the surge in investment, enthusiasm and euphoria in the new technological revolution ends until it ends.

The “circular spending” in AI has is another reason for one of the most common questions today: “Are we in an AI bubble?” Here’s how some knowledgeable tech experts and experience money managers answer the question.

“Are we in an AI bubble? Of course! Of course we are. I mean, we’re hyped, we’re accelerating, we’re putting enormous leverage into the system,” said Pat Geisinger, former Intel CEO.

“We’re certainly seeing lots of evidence of bubble-like behavior in the AI space. We see the kind of circular revenue deals, we see a lot of very aggressive price behavior,” said Ben Inker, Co-Head of Asset Allocation at GMO.

And, finally, Howard Marks, Co-Founder of Oaktree Capital Management said, “To me, the main ingredient in bubbles is psychological excess — there’s no such thing as a price too high. And I don’t detect that level of mania at this time, so I have not put the bubble label on this incident.”

To me the balloon is holding a lot of air, but with more room before it pops. I experienced the day by day – really, hour by hour – mania leading up to the dot-com bubble implosion. This when I first lived what FOMO means. People actually had a fear of missing out. The Nasdaq index soared over 50% from late October of 1999 through year end. And then it jumped another 25% by March 1, 2000. That’s all after a phenominal bull market in the Nasdaq that went up 10x from April of 1991. The great 1990’s dot-com bull market bubble popped only after investors lost control of rational behavior – when it was thought that no price was too high. We are not there… yet.

TAKING PERSPECTIVE…

Proper Perspective:  In our hectic and often hard to comprehend world, it is very easy to lose perspective. You may agree it is sometimes difficult to see the big picture. The media often doesn’t help with this, but unfortunately instead encourages us to see things in a negative way. Here is hopefully a pause to gain positive perspective.

Famous Quote On This Day:   “The fallacy of genetic determinism is to suppose that the genes ‘make’ the organism.”

~~Richard Lewontin, 1997

What Happened On this Day October 23, 1850: – First National Women’s Rights Convention begins in Worcester, Massachusetts, US.

MARKET ANALYSIS

INDICATORS OF INTEREST:

  • Market’s Current Signal: Confirmed Uptrend.  Analysis of the stock market over 130 years of history shows we can view it in terms of three stages -market in uptrend, uptrend under pressure and market correction.  Since the 1880’s, this perspective has led to investment out-performance relative to market indexes. This is due to trend analysis which determines risk reducing, return enhancing market entry and exit points. The U.S. stock market’s current signal indicates the market is in Confirmed Uptrend. That officially happened April 22 and is still intact. This has been the fastest market rebound from a bear market low in history. The uptrend is remains. October 12 is the 3rd anniversary of this bull market.

The Stock Market Trend: Confirmed Uptrend. The stock market powered higher Tuesday, April 22 and the Nasdaq and S&P 500 confirmed new rally attempts. That follow-through signaled a Confirmed Uptrend. In late June the major stock market indexes reclaimed levels set in late February and significantly above the pre-“Liberation Day” level. The major indexes are making new all-time record highs. October 8 was the 33rd new high of 2025 for the SP 500.

Here are key market levels as of Monday, October 23:

Recapping Last Week

U.S. equity indices managed to hold onto weekly gains despite macroeconomic headwinds, including the ongoing government shutdown, trade tensions with China, and rising concerns about private credit and regional bank loans. The S&P500 and Nasdaq Composite indices gained around 2%, while the Russell 2000 ended higher by 2.4%, declining slightly from a new record high reached midweek. All sectors posted positive performance, but financials lagged despite strong earnings reports from the large U.S. banks. Shares of Zions Bancorp tumbled after revealing losses tied to commercial and industrial loans, while Western Alliance sank after disclosing a lawsuit it had initiated regarding a business loan. Gold futures jumped over 7% to near $4,400 before pulling back on Friday after some positive signs emerged in U.S.-China trade relations. President Trump said that the proposed 100% tariffs on goods from China were not sustainable and confirmed that he would meet with Chinese President Xi Jinping in two weeks. Oil futures fell 1.7% while cryptocurrency prices remained under pressure for a second straight week. U.S. economic news was limited as the government shutdown extended into a third week, with no resolution in sight. As a result, Treasury yields briefly touched the lowest level since April as investors remained somewhat in the dark on the health of the U.S. economy. At a conference, Fed Chair Powell delivered prepared remarks noting that data available prior to the shutdown reflected economic activity on a modestly firmer trajectory than expected. He also said the outlook for inflation and employment does not appear to have changed since the last FOMC meeting, signaling that another quarter-point rate cut is likely later this month. With September’s official retail sales report delayed, the Chicago Fed Advanced Retail Trade Summary estimated a 0.5% advance, though higher prices likely impacted that rise. Regional manufacturing surveys showed mixed results, as activity increased modestly in New York state this month while the Philadelphia area slumped to the lowest level since April. The release of housing starts and permits was delayed, but the latest NAHB housing index reading jumped to 37 in October from 32 as future sales expectations topped the breakeven level of 50 on optimism for lower mortgage rates.

Overseas, China’s exports rose 8.3% last month while shipments to non-U.S. ports grew nearly 15%. The limited impact from U.S. tariffs on overall trade may give China leverage in trade negotiations. Domestic consumption remained weak as China’s consumer and producer prices fell 0.3% and 2.3% YoY, respectively. Finally, the British economy expanded by just 0.1% in August, suggesting that Q3 GDP may decelerate from the lackluster 0.3% growth in Q2. UK employment has held up better than expected, however, and wage growth has cooled slightly.

Current View

Another wave of selling hit top-rated growth stocks in the stock market yesterday. This marked another distribution day for the Nasdaq index, falling 0.9% in higher volume. But the index closed off lows and made a stand at its 21-day exponential moving average. The distribution day count is rising as yesterday was #6 for the Nasdaq. Selling was less pronounced in the S&P 500, which fell 0.5% and also notched a distribution day. The S&P 500 also ended off lows after touching its 21-day line. Institutional investors were clearly taking profits in leading growth stocks. Speculation is increased greatly as there has been a clear re-birth of the “meme” investors. Unprofitable with in some cases zero revenue nuclear stocks got nuked yesterday. Beyond Meat was beyond-real the last 2-3 days. Moves of up over 100% and then reversing down to lose all that gain in one day is wild, even for meme stocks!

October 12 was the 3rd anniversary of the bull market. While bubble talk is bubbling up, here’s some bull market perspective. Of all bull markets in over the last 50 years that have reached 3 years, on average average the total duration of the bull run was 8 years. Could be 5 years left? Another historical record my be broken by the SP500. It has as of yesterday it has remained above its 50-day moving average for 121 consecutive trading sessions. That is the 3rd longest streak since 1990.

  • Industry Group Strength:  BULLISH. As of yesterday, 156 out the 197 groups I monitor are up year-to-date. 41 groups are down for the year.
  • New Highs vs. New Lows:  BULLISH. In yesterday’s session, there were 120  new 52-week highs and 104 new 52-week lows.
  • Dow Dividend Yield:  BEARISH. The current yield for the Dow Jones Industrial Average is 1.80%. The 10-year Treasury now 4.00%.
  • Volatility Index:  NEUTRAL. Volatility has been volatile. The “VIX” is now 18, up from 17 two weeks ago. The index is also known as the “Fear Index.” It is considered a contrarian indicator and therefore viewed as bullish as it rises indicating investors are becoming more fearful. The VIX:
502fdd07-23bc-47a7-ad04-cc3b3f2387db image
  • Fear / Greed Index: BULLISH.  Investors are driven by two emotions: fear and greed. Too much fear can create a condition of oversold/ undervalued stock prices. Too much greed can result in overbought/overvalued stock prices. The AAII Investor Sentiment Index is now neutral.   BE FEARFUL WHEN OTHERS ARE GREEDY. At 28, the Fear & Greed Index is up from 49 two weeks ago.

CLICK VIDEO FOR MORE ON THE “FEAR & GREED INDEX”

How CNNMoney’s Fear & Greed Index works

  • Bull / Bear Barometer:  BEARISH. This secondary market indicator should also be viewed with a contrarian perspective. As of yesterday, according to the latest survey of stock market newsletter writers by Investor’s Intelligence, the bullish tally is 52.8%, down from 57.2% two weeks ago. The bears are 15.1%, near the 15.4% two weeks ago. Consider this a contrarian indicator because the crowd is often wrong at market tops and bottoms. In other words, extreme bullishness has been seen near several market tops in the past, while extreme bearishness has been seen at market bottoms.
  • Put / Call Ratio: BEARISH. The ratio of put-to-call options is 0.37, the same as two weeks ago. The put-call ratio tracks the mood of what options investors are doing, not just saying. They typically buy puts if they think a stock will decline and calls if they think it will rise. If they’re buying lots of puts, they see the market declining. And if they’re loading up on calls, they’re generally bullish. Historically, market bottoms occurred when the reading spikes to 1.2 or more. Market tops are often made when the reading is 0.6 or less. Note how reliable this is with respect to the February record low coinciding with the market high. Keep in mind this is also a contrarian indicator.

ECONOMIC UPDATES

Global Economic Indicators & Analysis:

Government Shutdown Delays Many Economic Report Releases.

Today is the 22nd day of the shutdown. This is officially the second-longest government shutdown in U.S. history.

POSITIVE INDICATORS

Recession Concerns Fall: Global recession concerns fell to their lowest level since February 2022, Bank of America’s October global fund manager survey shows. The survey also reveals the biggest six-month surge in growth optimism since October 2020. An eight-month high of 33% of investors surveyed expect a ‘no landing’ scenario, where both growth and inflation remain strong, compared with 18% in September. Expectations of a ‘soft landing’ fell to a six-month low of 54% who anticipate this scenario, down from 67% in September. A ‘soft landing’ is where inflation is lowered without a meaningful economic slowdown. Only 8% forecast a ‘hard landing’–a significant economic slowdown or recession combined with falling inflation–compared with 10% in September, the survey says.

Empire State Manufacturing Survey Up: Business activity increased modestly in New York State in October, according to firms responding to the Empire State Manufacturing Survey. The headline general business conditions index climbed nineteen points to 10.7, its third positive reading in the last four months. New orders edged higher and shipments increased. Delivery times were slightly longer, and supply availability continued to worsen somewhat. Inventories were little changed. Employment increased, while the average workweek was slightly lower. The pace of both input price increases and selling price increases picked up. Capital spending plans remained soft. Firms grew more optimistic about the outlook, with close to half expecting conditions to improve in the months ahead.

WEAK INDICATORS

Beige Book Down: Reports from across the U.S. indicate sluggish economic conditions in much of the country, with only three of the Federal Reserve’s 12 district banks reporting expanding activity in their regions, according to the Fed’s latest “beige book” report. The remaining nine districts reported either flat or contracting economic activity. “It’s not like everything’s rosy and booming,” Fed governor Christopher Waller said last Thursday, referring to the survey of regional economies. Waller said he thought a quarter-point rate cut at the Fed’s October meeting is “the right thing to do.”   Consumer spending inched down in recent weeks, despite some strength in electric-vehicle sales ahead of the expiration of a federal tax credit. Labor markets were soft, with more employers reporting they were reducing head counts through layoffs and attrition. The beige book report has taken on more importance this month because of the data drought caused by the federal government shutdown.

Call me if you have any questions. I am always happy to help!

John J. Gardner, CFP®, CPM®.AIF®

Blackhawk Wealth Advisors, Inc.

3860 Blackhawk Rd, Ste. 160 Danville, CA. 94506

Phone: 888-985-PLAN · Email: jg@blackhawkwealthadvisors.com

BLACKHAWKWEALTHADVISORS.COM

For my Quarterly Market Focus podcast, click on the link below. I provide a review of global stock market highlights over past quarter and preview of the quarter ahead. Forward insights and perspectives are based on current financial market and economic trends with an emphasis on relevant developments in various areas from Fed policy to company earnings announcements.

LinkedIn
810c9060-6bc9-4e20-948f-60bee7c1b0be image
dc6d6594-dfce-48b0-8d69-3a27db12748d image
7d2eabf6-51c8-425f-b667-128ed7bc0dd2 image

Blackhawk Wealth Advisors is the parent corporation of Equity Research & Portfolio Evaluation and Blackhawk Asset Management. It’s Chief Investment Officer is John J. Gardner. John is a Certified Financial Planner (CFP®) and Certified Portfolio Manager (CPM®). As an AIF®, John is also an Accredited Investment Fiduciary.

CUSTOMIZED. STRATEGIC. DYNAMIC.