ERPE Excerpts 8.28.26 – The GOATs

Bi-MONTHLY MARKET ANALYSIS &
ECONOMIC UPDATES
ERPE Excerpts on a Friday?? Yes. Just back from Italy. Marisa, my oldest daughter, got married last week!! Best excuse I could give for missing the normal Thursday publication. Hope you enjoy my take on the stock market GOATs….
Here’s the Bride and her proud Pop.
August 28, 2026
The GOATs:
Nvidia & Cisco
Mohamad Ali would be the first to tell you he was the greatest! No disputing that here. Michael Jordan, Jack Nicklaus, Tom Brady and athletes of all sports have earned the “GOAT” title, The Greatest of All Time. The stock market has produced two GOATs in recent bull market history: first, Cisco of the 90’s dot-com boom and now Nvidia in the current AI powered bull market. I want to offer a comparison between the GOAT stocks. Hopefully this is helpful perspective. The saying that “stocks take the escalator up and the elevator down” is wisdom. The explosive rise in Cisco stock ended with a tremendous fall. From its peak of about $80 in March of 2000, CSCO fell steeply and continuously to $8 by October of 2002. After nearly 10 years of climbing, it dropped 90% in about 18 months. The stock did not return to its 2000 price for 26 years until February of this year. Will Nvidia encounter a similar fate? It is likely a matter of when, not if. RCA was the ultimate “tech darling” of the Roaring Twenties, rising 200-fold in value on excitement over radio technology. After peaking in September 1929, the stock lost roughly 98% of its value by mid-1932 during the Great Depression.
Ali was the “undisputed heavyweight champion of the world” from 1974 to 1978. Cisco stock was the dominant outperformer of the still unprecedented internet driven bull market of the 90’s. From early 1991 to its peak in 2000, Cisco Systems stock soared from a split adjusted price per share of about 0.50 to $66. The stock split 9 times between March of 1991 and March of 2000. The meteoric move in Cisco’s stock price over that time was 15,900 percent. Nvidia, boosted by the AI bull market, has gained 2,200 percent since a low of about $10 in October of 2022.
It is helpful to identify parallels in the stock market. Mark Twain is famously credited with the saying, “History doesn’t repeat itself, but it often rhymes.” Valuable perspective can be gained from the study of stock market “rhymes”. History dating back to 1890 provides insightful stock and stock market behavior throughout market cycles, economic booms and busts, and revolutionary technological advances. Many Wall Street analysts are calling the AI bull market a “bubble” and point to the burst of the dot-com bubble burst as a warning. As my first mentor often said, “Trees don’t grow to the sky.” No trend, asset price, or economic growth can increase forever without a limit. So, too, will this AI bull market end. Like the extended dot-com bull market, history indicates these types of advances exceed expectations and, as Sir John Templeton said, “… die on euphoria.” The FOMO effect (Fear Of Missing Out) leads to that euphoria and ultimate market cycle top.
The structural parallels between Nvidia (NVDA) post-ChatGPT and Cisco Systems (CSCO) during the late-1990s Internet boom represent two of the most striking “picks and shovels” market rallies in financial history. Both companies emerged as the indisputable infrastructure backbone for a generational technology shift — Cisco building the routers and switches for the web, and Nvidia supplying the GPUs and CUDA ecosystem for generative AI. However, while the narrative framing is nearly identical, the underlying fundamental mechanics tell a nuanced story. One strong parallel between the two is expressed best by the “picks and shovels” analogy. These GOATs mastered the selling “shovels in a Gold Rush.” In March 2000, Cisco briefly became the most valuable company in the world (reaching a ~$500 billion market cap) because you could not build the internet without its hardware. Similarly, Nvidia’s post-2022 run to multi-trillion-dollar valuations was driven by compute dominance, with tech giants aggressively vying for its accelerator chips. Today Nvidia’s market cap exceeds $5 trillion! Also, both rallies were propelled by massive enterprise and hyperscaler infrastructure spending. Service providers built out fiber networks at any cost in 1999; hyperscalers built out clusters of data centers starting in late 2022. Furtherer, both management teams commanded peak gross margins exceeding 70% as demand severely outstripped supply, giving each company immense pricing power during the buildout phase.
These companies have some key differences. Who Cisco did business with and how they did it was less sustainable than the way Nvidia does business. Cisco sold heavily to speculative, debt-laden telecom startups (such as Winstar and Global Crossing) and routinely used vendor financing—loaning money to its own customers to buy its routers. When those startups collapsed, Cisco faced massive inventory write-downs. Nvidia’s core buyers are the best-capitalized, cash-rich megacaps on earth (Microsoft, Alphabet, Meta, Amazon), who finance AI buildouts using operational cash flow rather than high-yield debt. Also, the nature of Cisco’s hardware business and Nvidia’s business ecosystem vastly differ. Cisco sold commoditizable networking hardware running proprietary IOS, which competitors like Juniper eventually chipped away at. Nvidia sells compute hardware tightly integrated with CUDA—a software and compiler ecosystem refined over nearly two decades. Switching off Nvidia isn’t just buying another chip; it requires rewriting an entire enterprise’s software architecture.
Here’s a side-by-side comparison of the Cisco of the 90’s and Nvidia today:
Vector
Cisco Systems (1990–2001)
Nvidia
(2022–Present)
Monetization Layer
Hardware connectivity (Layer 1–3 routing)
Compute infrastructure & proprietary CUDA software stack.
Primary Customer Base
Highly levered telecom providers & early dot-coms.
Cash-flow dominant hyperscalers & sovereign AI initiatives.
Financing Mechanics
Extensive vendor financing / vendor-backed loans
Funded directly by hyperscaler CapEx budgets and fortress balance sheets.
Valuation Mechanics
Speculative multiple expansion outstripped earnings
Earnings expansion kept forward multiples anchored at reasonable levels.
Software Moat
Hardware-centric with proprietary IOS software, but vulnerable to commoditization.
Dual moat: Superior compute hardware tightly coupled with the CUDA software stack.
The boom/bust life cycle of stocks, as noted above with Cisco, is real. The risk to Nvidia can be thought of the “Digestion Cycle”. Nvidia is vulnerable to a CapEx digestion phase. If (more like when) the hyperscalers finish installing their initial GPU clusters and pause procurement to focus on software monetization, Nvidia could experience a temporary revenue drawdown. This cycle mirrors Cisco in 2001—not because the underlying technology (AI or the Internet) failed, but because infrastructure installation outpaced immediate software application demand. However, unlike Cisco — which suffered the lasting crash from its peak — Nvidia’s downside risk is mitigated by its structural profitability, lack of toxic vendor-financing exposure, and enterprise software lock-in. Even if an AI CapEx pause occurs, Nvidia’s high-margin software stack and ongoing datacenter refresh cycles provide a much stronger fundamental floor than Cisco possessed during the dot-com unwind. This may give investors more confidence in Nvidia’s stock going forward. Just remember, history often rhymes.

TAKING PERSPECTIVE…

Proper Perspective:  In our hectic and often hard to comprehend world, it is very easy to lose perspective. You may agree it is sometimes difficult to see the big picture. The media often doesn’t help with this, but unfortunately instead encourages us to see things in a most negative light. Here is hopefully a pause to gain positive perspective.

MARKET ANALYSIS

INDICATORS OF INTEREST:
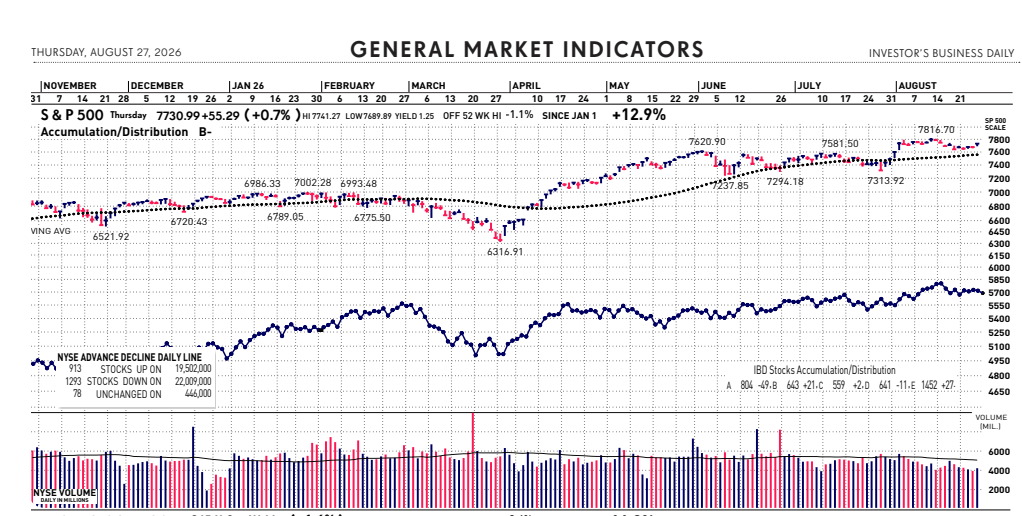
  • Market’s Current Signal: Confirmed Uptrend.  Analysis of the stock market over 130 years of history shows we can view it in terms of three stages -market in uptrend, uptrend under pressure and market correction.  Since the 1880’s, this perspective has led to investment out-performance relative to market indexes. This is due to trend analysis which determines risk reducing, return enhancing market entry and exit points.
Since June 1 the market’s trend strength has weakened as an increasing number of heavy distribution days entered the equation. On June 23, with the Nasdaq shouldering eight instances of pronounced professional selling, the market’s Confirmed Uptrend signal flashed a trend change to Uptrend Under Pressure. As the index received its ninth distribution day within a 25-session time frame on July 2, indicators began to flash more caution. July 24’s market action came close to a trend change to Market in Correction. That reversed positively to a trend turnaround to Confirmed Uptrend August 4 and was further confirmed with a follow-through day yesterday.
Here are key market levels as of Monday, August 24:
Recapping Last Week
Global markets were dominated last week by a rise in long-term bond yields, renewed geopolitical risk surrounding Iran and a powerful rally in cryptocurrencies. Major U.S equity indices, some of which were at record highs the prior week, finished lower with the S&P 500 falling 1.4%, the Nasdaq 100 2.4%, and the Russell 2000 falling 1.6%. Except for a few of the big tech names, earnings season is largely in the rear-view mirror, so, the biggest pressure on equities came from the Treasury market. Treasury Secretary Bessent responded to the rise in long-term yields by announcing that his agency would at least double the size of their purchases of longer-dated Treasuries. This isn’t like the Fed’s previous policy of quantitative easing, which was intended to inject liquidity into the financial system. Rather, it’s intended to reduce the pressure on longer-term yields, which have also been impacted by massive corporate issuance from the hyperscalers. This also increases a reliance on shorter term Treasuries to help finance the budget deficit. So long as the curve remains “normal” rather than inverted, there could be an additional benefit in the form of lower interest expenses on newly-issued shorter term debt compared to the higher rates on the long-end of the curve. The reaction wasn’t just limited to Treasuries and equities. The dollar broke sharply and provided the catalyst for gold to add another leg up on its multi-week rally. But the biggest beneficiary was crypto, which decisively broke out of its months-long slumber. On the same day that Bessent made his announcement, President Trump hosted a crypto summit at the White House where he called upon the Senate to pass the CLARITY Act establishing rules within the crypto space, which is scheduled for a procedural vote on September 15th. Bitcoin rallied over 22% on the week and the whole crypto-adjacent ecosystem went along for the ride. Health Care was by far the biggest winner among S&P sectors, up over 4% behind promising cancer treatment news out of Moderna. Energy was up 2.8%, as crude oil firmed up after the expiration of the 60-day cease-fire and refining margins remain near record highs since the onset of the war. Technology, down over 3.5%, was the biggest loser. Finally, late breaking on Friday was news that the trade talks between the U.S. and Canada broke down, leading to 50% tariffs on some $20B worth of Canadian goods with a response from the Canadians for a “dollar for dollar” retaliation. Market reaction in early overnight trading however was muted, as commentators noted that the overall trading relationship stands at over $900B.
Current View
A flurry of strong earnings reports in the software sector and a bullish revenue outlook from Nvidia (NVDA) on Thursday fueled another up session for the stock market. Nvidia jumped 8% and closed just above a short-term technical new buy point of 229.72. The artificial intelligence chip designer joined the Dow in November 2024. Even with another Dow component, Salesforce, surging 23% yesterday, the Dow squeaked out a meager 0.2% gain. It was an extremely mixed trading day for the major index. Four of the Dow 30 fell 2% or more and 10 lost at least 1%.  After several days of biding time near the 26,000 level and its 50-day moving average, the Nasdaq composite gapped above its 10-day moving average and jumped 1.6% in higher volume. Breadth was surprisingly weak, however, as winners barely edged out losers. Tech earnings again are fueling bullish Nasdaq gains.
  • Industry Group Strength:  BEARISH. As of yesterday, 65 out the 145groups I monitor are up year-to-date. 80 are down.
  • New Highs vs. New Lows: BULLISH.  In yesterday’s session, there were 267 new 52-week highs and 235 new 52-week lows.
  • Dow Dividend Yield:  BEARISH. The current yield for the Dow Jones Industrial Average is 1.65%. The 10-year Treasury now 4.67%.
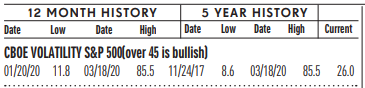
  • Volatility Index:  BEARISH. Volatility has been volatile. The “VIX” is now 18. This is up from 16 two weeks ago. The index is also known as the “Fear Index.” It is considered a contrarian indicator and therefore viewed as bullish as it rises indicating investors are becoming more fearful. The VIX:
502fdd07-23bc-47a7-ad04-cc3b3f2387db image
  • Fear / Greed Index:  BEARISH.  Investors are driven by two emotions: fear and greed. Too much fear can create a condition of oversold/ undervalued stock prices. Too much greed can result in overbought/overvalued stock prices. The AAII Investor Sentiment Index is now neutral.   BE FEARFUL WHEN OTHERS ARE GREEDY. At 55, the Fear & Greed Index is up from 46  two weeks ago.
CLICK VIDEO FOR MORE ON THE “FEAR & GREED INDEX”
  • Bull / Bear Barometer:  NEUTRAL. This secondary market indicator should also be viewed with a contrarian perspective. As of yesterday, according to the latest survey of stock market newsletter writers by Investor’s Intelligence, the bullish tally is 49.1%, down from 50.9% two weeks ago. The bears are 17%, down from 20% two weeks ago. Consider this a contrarian indicator because the crowd is often wrong at market tops and bottoms. In other words, extreme bullishness has been seen near several market tops in the past, while extreme bearishness has been seen at market bottoms.
  • Put / Call Ratio: BEARISH. The ratio of put-to-call options is .84, up from 0.61 two weeks ago. The put-call ratio tracks the mood of what options investors are doing, not just saying. They typically buy puts if they think a stock will decline and calls if they think it will rise. If they’re buying lots of puts, they see the market declining. And if they’re loading up on calls, they’re generally bullish. Historically, market bottoms occurred when the reading spikes to 1.2 or more. Market tops are often made when the reading is 0.6 or less. Note how reliable this is with respect to the February record low coinciding with the market high. Keep in mind this is also a contrarian indicator.

ECONOMIC UPDATES

Global Economic Indicators & Analysis:
POSITIVE INDICATORS
Jobless Claims Down: U.S. initial jobless claims fell to 203,000 in the week ending August 22, 2026, dropping by 4,000 from the previous week’s revised level. This exceeded The Wall Street Journal economist consensus estimate of 208,000. Continuing Claims fell by 18,000 to 1.778 million for the week ending August 15. This was released yesterday.
Durable Goods Orders Up: New orders for manufactured durable goods in July, up four of the last five months, increased $3.6 billion or 1.1% to $339.3 billion, the U.S. Census Bureau announced Wednesday. This followed a 0.5% June increase. Excluding transportation, new orders increased 0.4%. Excluding defense, new orders increased 1.3%. Transportation equipment, up following two consecutive monthly decreases, led the increase, $2.6 billion or 2.3% to $116.2 billion.

WEAK INDICATORS

PCE Up: The Personal Consumption Expenditure index, an inflation indicator, rose last month. Personal income also increased $115.1 billion (0.4 percent at a monthly rate) in July, according to estimates released today by the U.S. Bureau of Economic Analysis (BEA). Disposable personal income (DPI)—personal income less personal current taxes—increased $125.9 billion (0.5 percent), and personal consumption expenditures (PCE) increased $36.3 billion (0.2 percent). Real PCE increased $1.3 billion (less than 0.1 percent at a monthly rate) in July. From the preceding month, the PCE price index for July increased 0.2 percent. Excluding food and energy, the PCE price index also increased 0.2%. From the same month one year ago, the PCE price index for July increased 3.7%. Excluding food and energy, the PCE price index increased 3.3% from one year ago.
Call me if you have any questions.  I am always happy to help!
John J. Gardner, CFP®, CPM®.
Blackhawk Wealth Advisors, Inc.
Phone: 888-985-PLAN · Email: jg@blackhawkwealthadvisors.com