ERPE Excerpts 8.13.26 – From the TV to AI

From TV to AI
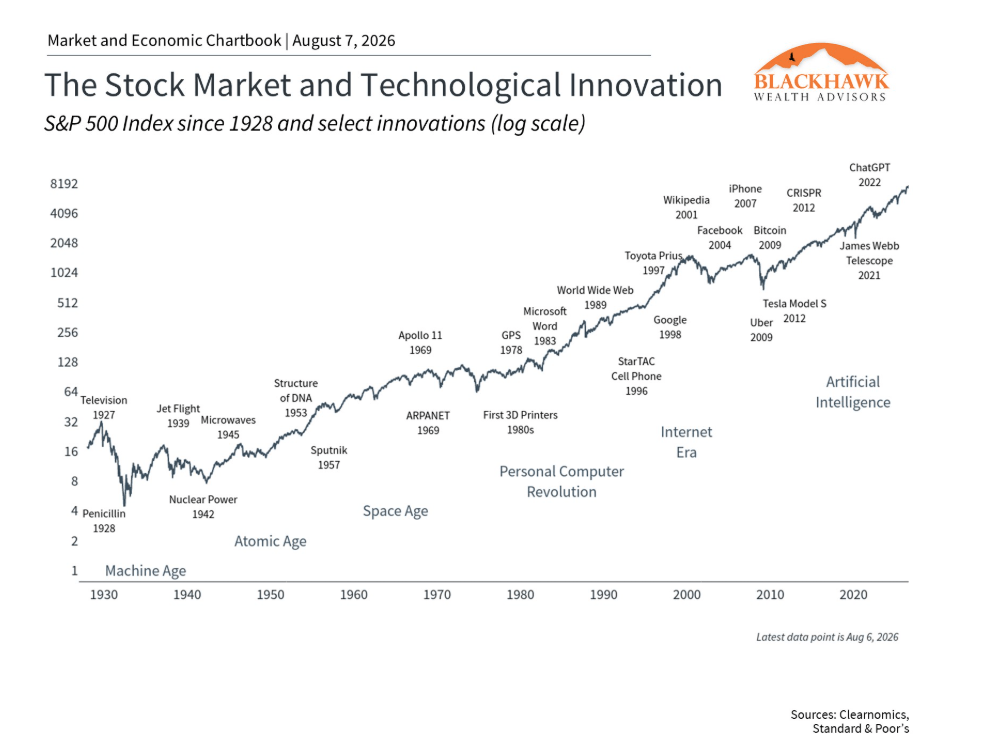
100 Years of Tech Innovation & the SP 500
From the Machine Age and the invention of TV to the release of Artificial Intelligence with ChatGPT, the U.S. stock market has been powered by technological innovations since 1927. The graph below shows the history of the major tech innovations and the SP 500 over nearly the last 100 years.
Now on nearly a daily basis, there are headlines about AI investments, new large language models, and the companies behind them. I want to help you step back from the constant news flow and understand the bigger picture of what AI really means for markets, the economy, and your perhaps your portfolio. The key fact is that AI is not just about chatbots or a few stocks. Instead, a broad set of industries, business models, and investment opportunities make these capabilities possible. This is similar to the technology boom of the 1990s which may have begun with a few companies, but is now a large, important part of the global economy.
Understanding the most important parts of the AI value chain
When most people think about AI investing, they think about companies like Google, OpenAI, Anthropic, and others. These are the firms building the large language models that power tools like Gemini, ChatGPT, and Claude. But they represent only one piece of a much larger puzzle. At the foundation is semiconductor hardware, including GPUs and memory chips, which are needed both to train AI models and to run them. Training a large AI model requires thousands of connected servers working together for months. Running these models requires computing resources every single time someone enters a prompt. This is why demand for specialized chips has grown so dramatically. These chips are housed in data centers, which are essentially warehouses filled with servers that run around the clock. They require significant amounts of electricity, cooling systems (including water), and physical infrastructure. Spending on data center construction has surged, contributing to overall economic activity. Finally, there are the businesses and software providers that are putting AI to work. This includes everything from AI-powered applications to businesses using AI internally to improve productivity. This layer is perhaps the hardest to evaluate right now since it will take time to see measurable results.
How will AI continue to impact investors?
One of the central questions in markets today is whether the enormous sums being invested in AI infrastructure will eventually generate sufficient returns. The largest technology companies are spending hundreds of billions of dollars building out data centers and computing capacity. This has led to volatility in AI-related stocks over the past year, as investors have shifted back and forth between optimism about growth and concerns about whether demand will keep pace. We have already seen some boom-bust cycles in a handle full of companies expected to gain substantially from AI. In a more macro fashion, entire industry groups have risen, collapsed, and risen again due to AI. The enterprise software stocks are the best example of that.
History tells us that even when a trend is real, it often takes time for it to play out. After all, today’s megacap tech companies have taken thirty years or more to get to where they are today. In the meantime, markets can overestimate how quickly new technologies translate into profits. Perspective and portfolio balance are important virtues in scenarios like these. As AI has captured investor attention, valuations across technology-related sectors have risen steadily. It is worth noting that these higher valuations reflect strong earnings growth for many of these companies as well. Clearly, earnings growth rates have been extraordinary. The Information Technology sector currently trades at elevated levels relative to its own history and relative to the broader market. Other sectors containing large technology companies, including Communication Services and Consumer Discretionary, show similar patterns, reflecting expectations about future profitability.
Your portfolio should be designed with all of these considerations in mind. It provides participation in the growth potential of technology and AI-related industries while also maintaining exposure to areas of the market that offer stability and value. This kind of balance is what allows investors to stay on track through the inevitable periods of market volatility that come with any major technological shift. The most important thing to remember is that your long-term financial goals, whether that means a comfortable retirement, providing for your family, or building lasting wealth, should not change based on any single market trend. The principles that guide your financial plan are built to work across many different market environments.
As always, please do not hesitate to reach out if you have questions or would simply like to talk through what these developments mean for your specific situation.

TAKING PERSPECTIVE…

Proper Perspective:  In our hectic and often hard to comprehend world, it is very easy to lose perspective. You may agree it is sometimes difficult to see the big picture. The media often doesn’t help with this, but unfortunately instead encourages us to see things in a most negative light. Here is hopefully a pause to gain positive perspective.

MARKET ANALYSIS

INDICATORS OF INTEREST:
  • Market’s Current Signal: Confirmed Uptrend.  Analysis of the stock market over 130 years of history shows we can view it in terms of three stages -market in uptrend, uptrend under pressure and market correction.  Since the 1880’s, this perspective has led to investment out-performance relative to market indexes. This is due to trend analysis which determines risk reducing, return enhancing market entry and exit points.
Since June 1 the market’s trend strength has weakened as an increasing number of heavy distribution days entered the equation. On June 23, with the Nasdaq shouldering eight instances of pronounced professional selling, the market’s Confirmed Uptrend signal flashed a trend change to Uptrend Under Pressure. As the index received its ninth distribution day within a 25-session time frame on July 2, indicators began to flash more caution. July 24’s market action came close to a trend change to Market in Correction, which flashed again yesterday. This deserves close attention. This all reversed positively to a trend turnaround to Confirmed Uptrend August 4.
Here are key market levels as of Monday, August 10:
Recapping Last Week
Global equity markets continued to push higher last week, with U.S. stocks extending their recent gains despite a sharp deterioration in labor-market data. The S&P 500 pushed into record highs as investors continued emphasizing strong corporate earnings despite growing evidence that the economy is slowing. The week also brought further signs of de-escalation in the Iran conflict, which helped pull oil prices lower while reducing some of the inflationary risk that had been weighing on markets. By the end of the week, though, a surprisingly weak July employment report Friday shifted attention back to the U.S. economy: the data showed a loss of 23k jobs in July against market expectations of an 80k increase. The unemployment rate nonetheless ticked down to 4.1% from 4.2%, driven in part by a decline in labor force participation. Average hourly earnings also came in under even the low range of economists’ expectations, rising just .1% for the month and 3.2% year over year. The data reduced market expectations for a 25bps September rate hike to 44%. Meanwhile, equity markets remained buoyant, supported by strong corporate earnings. Aggregate earnings for S&P companies were up nearly 50% year over year. It’s worth noting, though, that outsized reports from a small number of components, like Alphabet’s $98B unrealized gain in the value of equity securities (notably its stake in SpaceX) and Amazon distorted those numbers somewhat. Removing these results delivers a still impressive but more understandable 28%. While investors are increasingly concerned about the hyperscalers’ enormous capital expenditures to buildout AI infrastructure, earnings season has reinforced the notion that corporate profitability is a significant tailwind for U.S. equities and has helped to rationalize current valuations. S&P 500 sector performance was led by Tech, up over 7%, while Energy was the laggard, down over 3%– early in the week, when Treasury Secretary Bessent stated in a Tuesday interview that he believed a deal could be reached “today or tomorrow” regarding the Strait of Hormuz, prices dropped. When no deal emerged within that timeline, and Iranian state media claimed that any deal would still not permit Israeli or U.S. ships to pass through the strait, energy markets firmed up. The dollar remained under pressure in the aftermath of last week’s coordinated intervention to support the Yen which also provided the catalyst for other previously sleepy risk assets to finally catch a bid, most notably precious metals, led by gold making a 2-month high.
Current View
As I reiterate below, the combo of positive economic conditions and surprisingly strong earnings are lifting the market. The follow through day of early August confirms the new market rally.
The E’s are continuing to boost the stock market: Earnings & Economics. Earnings are truly the biggest booster now. The upside surprises and positive guidance are a tremendous catalyst for the stock market across all sectors.
  • Industry Group Strength:  BEARISH. As of yesterday, 65 out the 145groups I monitor are up year-to-date. 80 are down.
  • New Highs vs. New Lows: BULLISH.  In yesterday’s session, there were 267 new 52-week highs and 235 new 52-week lows.
  • Dow Dividend Yield:  BEARISH. The current yield for the Dow Jones Industrial Average is 1.65%. The 10-year Treasury now 4.67%.
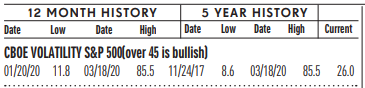
  • Volatility Index:  BEARISH. Volatility has been volatile. The “VIX” is now 18. This is up from 16 two weeks ago. The index is also known as the “Fear Index.” It is considered a contrarian indicator and therefore viewed as bullish as it rises indicating investors are becoming more fearful. The VIX:
502fdd07-23bc-47a7-ad04-cc3b3f2387db image
  • Fear / Greed Index:  BEARISH.  Investors are driven by two emotions: fear and greed. Too much fear can create a condition of oversold/ undervalued stock prices. Too much greed can result in overbought/overvalued stock prices. The AAII Investor Sentiment Index is now neutral.   BE FEARFUL WHEN OTHERS ARE GREEDY. At 46, the Fear & Greed Index is up from 62  two weeks ago.
CLICK VIDEO FOR MORE ON THE “FEAR & GREED INDEX”
  • Bull / Bear Barometer:  NEUTRAL. This secondary market indicator should also be viewed with a contrarian perspective. As of yesterday, according to the latest survey of stock market newsletter writers by Investor’s Intelligence, the bullish tally is 49.1%, down from 50.9% two weeks ago. The bears are 17%, down from 20% two weeks ago. Consider this a contrarian indicator because the crowd is often wrong at market tops and bottoms. In other words, extreme bullishness has been seen near several market tops in the past, while extreme bearishness has been seen at market bottoms.
  • Put / Call Ratio: BEARISH. The ratio of put-to-call options is .84, up from 0.61 two weeks ago. The put-call ratio tracks the mood of what options investors are doing, not just saying. They typically buy puts if they think a stock will decline and calls if they think it will rise. If they’re buying lots of puts, they see the market declining. And if they’re loading up on calls, they’re generally bullish. Historically, market bottoms occurred when the reading spikes to 1.2 or more. Market tops are often made when the reading is 0.6 or less. Note how reliable this is with respect to the February record low coinciding with the market high. Keep in mind this is also a contrarian indicator.

ECONOMIC UPDATES

Global Economic Indicators & Analysis:
INFLATION IPACT
This week’s economic indicators with the biggest impact near-term are both inflation measures. The CPI yesterday and the PPI today. Last Friday’s jobs report was also critical to the macro view on inflation and a big factor relative the Fed’s interest rate policy. The Federal Open Market Committee, the Federal Reserve bank’s rate-setting body, does not meet again until September, so it will have an additional month of inflation data to digest before it has to make a decision. Friday’s jobs numbers had an immediate effect by lowering expectations for a near-term rate hike. Traders cut the probability for a September rate hike, lowering the odds to 42%, according to the CME Group’s FedWatch gauge of futures prices after Friday’s report. In a nutshell, the weak jobs report and the ensuing tame CPI gives the Fed less cause to raise interest rates.
CPI Down: Yesterday, the Labor Department said the consumer price index, or CPI, rose 0.1% in July, with a 3.4% annual increase. The core CPI, which excludes food and energy, was up 0.2% on the month and 2.5% year over year. On an annual basis, the inflation rates were 3.4% and 2.5%, both down 0.1 percentage point from June. Energy prices dropped another 1.5% for the month following a 5.7% decrease in June. Still, the sector saw an annual increase of 14.7% following sharp gains in prior months, including a 10.9% surge in March just after the attacks against Iran began.
PPI Down: Wholesale prices were flat in July, below expectations for 0.2% increase. Today’s producer price index was flat in July compared with expectations for a 0.2% increase. Core PPI rose 0.2%, below the 0.3% forecast. PPI measures wholesale inflation and was the latest metric to show easing price pressures after months of gains. On an annual basis, the headline PPI increased 4.7% for the all-items index and 4.2% for core, according to unadjusted figures, according to the Bureau of Labor Statistics.
As i noted above, market expectations have switched in recent days, with traders now pricing in a rate hike in October or December after putting heavy odds that the Federal Open Market Committee would move at its next meeting on September 15-16. A September rate hike is now effectively off the table, and a bump in rates is seen as unlikely even after the Fed’s October 27-28 meeting. The celebrated tame inflation reports coupled the jobs market picture has the stock market rallying.
Call me if you have any questions.  I am always happy to help!
John J. Gardner, CFP®, CPM®.
Blackhawk Wealth Advisors, Inc.
3860 Blackhawk Rd. Ste. 160 Danville, CA. 94506
Phone: 888-985-PLAN · Email: jg@blackhawkwealthadvisors.com