ERPE Excerpts 9.11.2025 Nuclear Renewal

Bi-MONTHLY MARKET ANALYSIS &

ECONOMIC UPDATES

September 11, 2025

The Renewal of Nuclear

But first, and much more importantly, please let me remind you to, if not already, take a moment to reflect on the tragic day of September 11, 2001. We can now only look back at “9/11” 24 years later with sadness for those many lives lost and pray nothing like it ever happens again, and… never forget. Please click on this link in memory of 9/11.

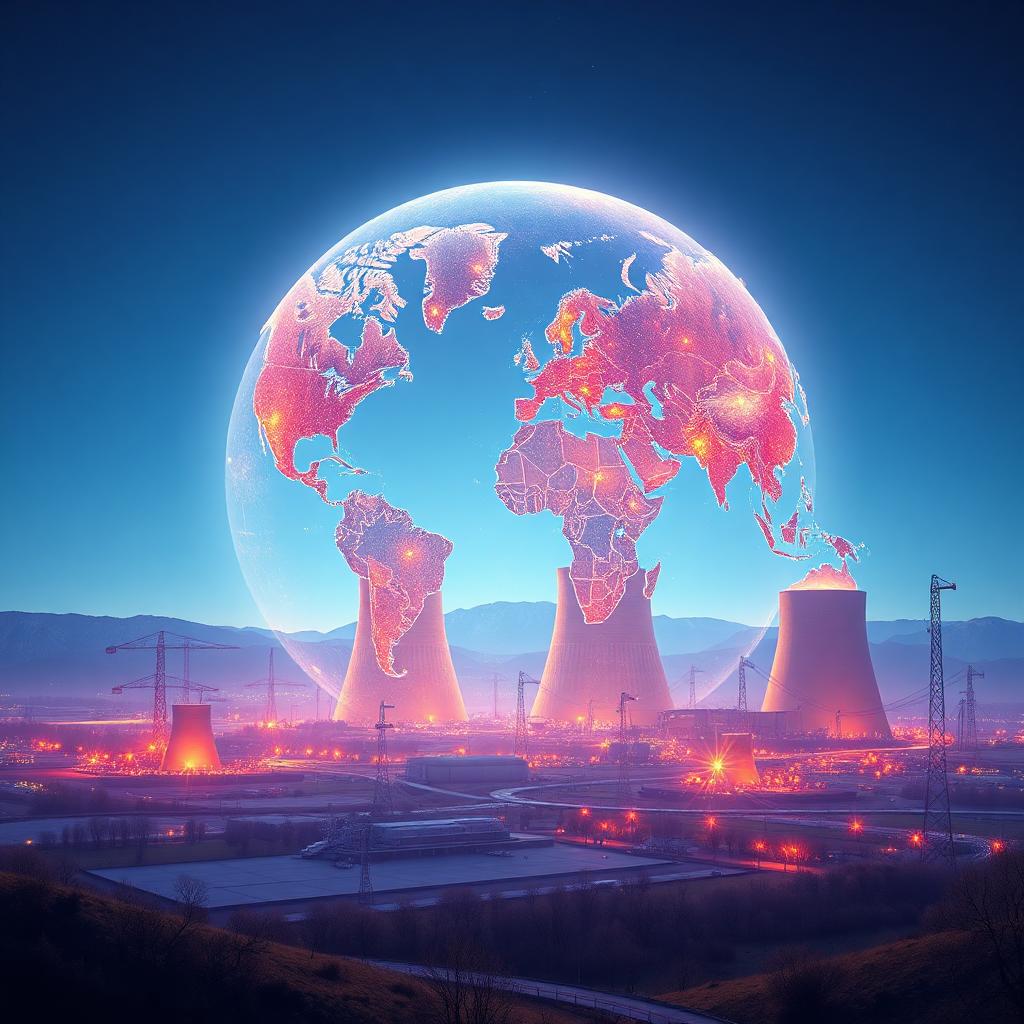
Call it a comeback. Nuclear power is experiencing a significant resurgence. Surging electricity demand from sources like AI are a major catalyst. The question is no longer whether nuclear energy will play a role in the digital economy, but how quickly it can be scaled to meet the insatiable demand of AI and beyond. The renewed interest in nuclear energy has also bee driven by global efforts to achieve energy security, and to meet climate goals. Key factors fueling this trend include governmental support through policies and funding, technological advances like Small Modular Reactors (SMRs), and increased private investment from big tech companies. Here’s more on the tech giant’s giant impact on nuclear demand. As artificial intelligence, cloud computing, and electrification drive unprecedented demand for power, the old playbook of relying solely on renewables and natural gas is proving insufficient. So, tech giants are turning toward nuclear, not cautiously, but with bold, multibillion-dollar commitments that could reshape the energy landscape for decades to come. Deals are being signed, supply chains are being built, and microreactors (SMR’s) are moving from concept to test phase at a pace few would have predicted even five years ago. Did I say giant tech companies? I’m referring to Microsoft, Google, Amazon – for example – that are now committing what could soon approach hundreds of billions of dollars to the nuclear power development.

How’s this for alphabet soup? The DOE, NRC and IEA all are reporting positive and meaningful progress relating to the renewed momentum behind nuclear energy. In a recent report from the IEA (The International Energy Agency), “The Path to a New Era for Nuclear Energy”, said more than 40 countries around the world have plans to expand nuclear’s role in their energy systems. Over 70 reactors are under construction worldwide. This is a due to incredible global demand for electricity. The IEA said, “The increasing use of electricity – to power everything from industry and air conditioning to electric vehicles and data canters amid the rise of artificial intelligence – is accelerating the growth in power demand, which is set to rise six times as fast as overall energy consumption in the coming decades.” As the world’s second-largest source of low-emissions electricity after hydropower, nuclear power today produces just under 10% of global electricity supply, according to the Agency. The DOE (U.S. Department of Energy) is moving forward with its efforts granted by the May signing by President Trump of the executive order, ” Reforming Nuclear Reactor Testing at the Department of Energy”.  Its goal is “to construct, operate, and achieve criticality of at least three test reactors using the DOE authorization process by July 4, 2026.” Then there’s the NRC (The Nuclear Regulatory Commission), which recently reported progress under the ADVANCE Act. That law was signed in July 2024 to accelerate the development and deployment of advanced nuclear technologies, including small modular reactors, by streamlining the Nuclear Regulatory Commission’s licensing process, establishing incentive prizes, and reducing regulatory costs.

The US, along with many other nations, has pledged to triple nuclear energy capacity by 2050, with governments actively promoting development and supply chain resilience. This, though, will not come without considerations and challenges. Challenges remain in reducing costs, addressing public concerns about safety, and navigating complex regulatory environments.

TAKING PERSPECTIVE…

Proper Perspective:  In our hectic and often hard to comprehend world, it is very easy to lose perspective. You may agree it is sometimes difficult to see the big picture. The media often doesn’t help with this, but unfortunately instead encourages us to see things in a most negative light. Here is hopefully a pause to gain positive perspective.

Famous Quote On This Day:  “Today, our nation saw evil, the very worst of human nature.”

~~ George W. Bush, 2001

What Happened On this Day September 11, 2001 –  The twin towers, a symbol of New York City centered in the heart of Wall Street – are destroyed during the worst terrorist attack in US history.

MARKET ANALYSIS

INDICATORS OF INTEREST:

  • Market’s Current Signal: Confirmed Uptrend.  Analysis of the stock market over 130 years of history shows we can view it in terms of three stages -market in uptrend, uptrend under pressure and market correction.  Since the 1880’s, this perspective has led to investment out-performance relative to market indexes. This is due to trend analysis which determines risk reducing, return enhancing market entry and exit points. The U.S. stock market’s current signal indicates the market is in Confirmed Uptrend. That officially happened April 22 and is still intact. This has been the fastest market rebound from a bear market low in history. The uptrend is remains.

The Stock Market Trend: Confirmed Uptrend. The stock market powered higher Tuesday, April 22 and the Nasdaq and S&P 500 confirmed new rally attempts. That follow-through signaled a Confirmed Uptrend. In late June the major stock market indexes reclaimed levels set in late February and significantly above the pre-“Liberation Day” level. Today the major indexes are at new all-time record highs. Yesterday was the 23rd new high of 2025 for the SP 500.

Here are key market levels as of Monday, September 11.

Recapping Last Week

U.S. equity indices recovered from a sharp drop to start the holiday-shortened week, racing to record highs before easing slightly after the latest employment data reinforced the likelihood of upcoming interest rate cuts. The Nasdaq Composite and Russell 2000 indices each rose around 1% while the S&P500 posted a marginal gain for the week. Treasury yields and the U.S. dollar tumbled on Friday after August’s non-farm payrolls increased by just 22,000 and the unemployment rate ticked up to 4.3%. The 10-year yield settled near 4.08%, breaking below a key technical support level near 4.20%. Gold futures soared nearly 4% to new all-time highs as fed funds futures moved closer to pricing in three rate cuts this year. Additional data suggested that the U.S. labor market has been weakening more than previously thought. Last month, job openings fell below the level of those seeking employment for the first time in more than four years, while private payrolls increased less than expected and layoffs were on the rise. While the weaker jobs data increased the probability for rate cuts beyond this month’s FOMC meeting, it also heightened concerns of a broader economic slowdown developing. Earlier last week, equities sold off after a federal appeals court ruled that most of the tariffs imposed by the current U.S. administration were illegal, calling into question the hundreds of billions of dollars in revenue already generated. Rising long-term government bond yields around the globe also rattled investors as budget deficits came into focus. In other economic news, ISM manufacturing PMI remained below the 50-level expansion threshold, although last month’s new orders rose to 51.4 from 48.7. Tariffs remained a headwind with the prices paid index coming in at a still-elevated 63.7. ISM services PMI climbed to 52.0 but also revealed cost pressures. Finally, reports indicated that OPEC+ was likely to consider another production increase at their upcoming meeting over the weekend. The potential for higher supply, along with prospects of a slowing U.S. economy, sent crude oil lower by 3% to $62 per barrel.

Overseas, Eurozone inflation rose slightly last month to 2.1% YoY, likely keeping the ECB in a holding pattern on rates in the near term. Core CPI was flat at 2.3% YoY while services inflation ticked down to 3.1%. In the UK, Prime Minister Starmer’s Labour party took another hit with the resignation of Deputy PM Rayner over a tax issue. Yields on the country’s 30-year gilts reached 5.68%–the highest level since 1998—as the government struggles to plug a large fiscal hole in its upcoming budget. Questions about the reliability of official economic data also surfaced after retail sales growth in the first half of 2025 was revised down to 1.1% from 1.7%, with statisticians discovering mistakes in seasonal adjustments.

Current View

For growth investors, Oracle (ORCL) confirmed at least one thing on Wednesday: It’s still an AI-led stock market. This is thee catalyst boosting the stock market to record highs again this year. Yesterday, the Nasdaq composite and the S&P 500 both marked a new high and a record close. According to Dow Jones Market Data, the Nasdaq registered its 23rd record close so far this year. There is undoubtedly powerful buying going on in high-quality growth companies that are helping to build a multi-trillion-dollar rollout of artificial intelligence across countries, enterprises and entire industries. Here’s a closer look at Oracle, which soared nearly 36% yesterday, and perspective on the volatility of growth stocks over the long run. Nearly 40 years ago, Oracle was both the innovator and king of enterprise database software. Then, when the dot-com bubble imploded, and the stock tanked big time. From its September 2000 peak of 46.47, Oracle stock slid to a multiyear low of 7.25 nearly two years later in June of 2002. Oracle fell more than 84%. Eventually, the stock returned to that high more than 12 years later in December of 2014. Today, Oracle is deep in the middle of the AI data center market. A Wall Street Journal report yesterday noted that OpenAI signed a deal to buy $300 billion in computing power over five years from Oracle. The stock is now near $315 a share.

  • Industry Group Strength:  BULLISH. As of yesterday, 120 out the 197 groups I monitor are up year-to-date. 77 groups are down for the year.
  • New Highs vs. New Lows:  BULLISH. In yesterday’s session, there were 269 new 52-week highs and 79 new 52-week lows.
  • Dow Dividend Yield:  BEARISH. The current yield for the Dow Jones Industrial Average is 1.83%. The 10-year Treasury now 4.03%.
  • Volatility Index: BEARISH. Volatility has been volatile. The “VIX” is now about 15, the same as two weeks ago. The index is also known as the “Fear Index.” It is considered a contrarian indicator and therefore viewed as bullish as it rises indicating investors are becoming more fearful. The VIX:
  • Fear / Greed Index: NEUTRAL.  Investors are driven by two emotions: fear and greed. Too much fear can create a condition of oversold/ undervalued stock prices. Too much greed can result in overbought/overvalued stock prices. The AAII Investor Sentiment Index is now neutral.   BE FEARFUL WHEN OTHERS ARE GREEDY. At 51, the Fear & Greed Index is down from 62 two weeks ago.

CLICK VIDEO FOR MORE ON THE “FEAR & GREED INDEX”

How CNNMoney’s Fear & Greed Index works

  • Bull / Bear Barometer:  BEARISH. This secondary market indicator should also be viewed with a contrarian perspective. As of yesterday, according to the latest survey of stock market newsletter writers by Investor’s Intelligence, the bullish tally is 57.7% up from 51% two weeks ago. The bears are 17.6%, about the same as two weeks ago. Consider this a contrarian indicator because the crowd is often wrong at market tops and bottoms. In other words, extreme bullishness has been seen near several market tops in the past, while extreme bearishness has been seen at market bottoms.
  • Put / Call Ratio: NEUTRAL. The ratio of put-to-call options is 0.71, up from 0.68 two weeks ago. The put-call ratio tracks the mood of what options investors are doing, not just saying. They typically buy puts if they think a stock will decline and calls if they think it will rise. If they’re buying lots of puts, they see the market declining. And if they’re loading up on calls, they’re generally bullish. Historically, market bottoms occurred when the reading spikes to 1.2 or more. Market tops are often made when the reading is 0.6 or less. Note how reliable this is with respect to the February record low coinciding with the market high. Keep in mind this is also a contrarian indicator.

ECONOMIC UPDATES

Global Economic Indicators & Analysis:

POSITIVE INDICATORS

PPI Down: Good news on the inflation front from producer prices. The producer price index slipped 0.1% last month compared to a revised 0.7% advance in July, the government said Wednesday. Wall Street economists had forecast a 0.3% increase. Producer costs reflect what companies pay each other for supplies. They often – but not always – herald changes in the rate of inflation. The increase in wholesale costs in the 12 months ended in August dropped to 2.6% from 3.1% in the prior month. Yet the so-called core rate, seen as a more stable measure of wholesale inflation, rose a sharper 0.3% in August. They had jumped 0.6% in July to post the biggest increase in three and a half years. The 12-month increase in the core rate moved up to 2.8% from 2.7% in the prior month. That’s the highest level since March and points to persistent if mild price pressures in the economy, mostly likely stemming from higher U.S. tariffs.

NFIB Up: The NFIB Small Business Optimism Index released Monday rose 0.5 points in August to 100.8, nearly 3 points above the 52-year average of 98. Of the 10 Optimism Index components, four increased, four decreased, and two were unchanged. The increase in those expecting real sales to be higher contributed the most to the rise in the Optimism Index. The Uncertainty Index fell by 4 points to 93 but remained well above the historical average. The decline was due to a decrease in uncertainty about financing expectations and planned capital expenditures. In summary, there was a notable improvement in overall business health. When asked to rate the overall health of their business, 14% reported excellent (up 1 point), and 54% reported it as good (up 2 points). Optimism was expressed as more owners reporting stronger sales expectations and improved earnings.

WEAK INDICATORS

Jobless Claims Up: The consumer price index – the main measure of U.S. inflation – rose 0.4% last month, the government said Thursday. That was one tick above the Wall Street forecast. The more critical core rate of inflation rose 0.3%, in line with expectations. The core rate omits food and energy and is seen as a better predictor of future inflation. The 12-month rate of inflation, measured by the CPI, rose to 2.9% last month from 2.7% in July. That’s the highest level since January. The core rate increased at a 3.1% pace in August, unchanged from the prior month. The Fed is widely expected to cut a key U.S. interest rate next week for the first time this year, but the higher-than-forecast rise in the CPI probably rules out a steeper 1/2-point reduction.

CPI Up: The consumer price index – the main measure of U.S. inflation – rose 0.4% last month, the government said today. That was one tick above the Wall Street forecast. The more critical core rate of inflation rose 0.3%, in line with expectations. The core rate omits food and energy and is seen as a better predictor of future inflation. The 12-month rate of inflation, measured by the CPI, rose to 2.9% last month from 2.7% in July. That’s the highest level since January. The core rate increased at a 3.1% pace in August, unchanged from the prior month. The Fed is widely expected to cut a key U.S. interest rate next week for the first time this year, but the higher-than-forecast rise in the CPI could rule out a steeper 1/2-point reduction.

ISM Manufacturing Down: The trade wars are slowly dying down. The damage to American manufacturers is not. Industrial production fell in August for the sixth month in a row, according to an index compiled by the Institute for Supply Management last Tuesday. The ISM surveys executives every month about how their businesses are doing. The ISM manufacturing index rose to 48.7% in August from 48.0% in the prior month. Any number below 50% signals contraction. The index for orders, a sign of future sales, turned positive for the first time in seven months. Yet the upturn was largely limited to just a few industries and is unlikely to last. Production, for instance, turned negative in August in a sign of weak demand. Employment, meanwhile, contracted for the seventh month in a row. Businesses are hesitant to hire in face of all the uncertainty. Prices of raw materials and supplies kept rising in August, though at a somewhat slower rate. Higher prices for steel and aluminum due to steep new tariffs are raising costs for manufacturers of all sorts.

Jobs Market Weak: A combination of a jump in unemployment and new jobs added in August that were less than a third of expectations tells the story of a weak labor market. U.S. unemployment rate jumps to nearly 4-year high. The 22,000 jobs added in the U.S. last month fell short of the 75,000 forecast of economists polled by the Wall Street Journal. The fourth month of subpar employment performance signals a dramatic stall in hiring and fully supports the Fed starting rate cuts at the next meeting.

Job Openings Down: The number of job openings in the U.S. fell in July to the second-lowest level since the pandemic, while hiring patterns signaled the labor market has weakened. Job postings dropped to 7.18 million in July from 7.36 million in the prior month, the government said Wednesday. It was the lowest level since last fall and the second smallest reading since 2020. Job openings are still higher compared with the last few months before the pandemic, but they have tumbled from a record 12.1 million in 2022. Companies simply aren’t hiring as many people as they grapple with ongoing uncertainty tied to higher U.S. tariffs. The so-called hiring rate was unchanged at 3.3% in July and stood at the lowest level since 2013, excluding the COVID-19 pandemic era. However, layoffs also remain very low. The number of people hired in July totaled 5.31 million, but the increase was almost entirely offset by 5.29 million “separations”, such as layoffs, job quitters, and retirements.

More Jobs Weakness Indicated: New data from the Bureau of Labor Statistics indicate the economy created half as many new jobs from early 2024 to early 2025 — amounting to about 71,000 new jobs a month instead of previously reported 147,000. In a major headline, the economy created 911,000 fewer jobs in the waning months of the Biden presidency and early stages of the Trump administration than had been reported. This was one of the biggest revisions ever.

Fed’s Beige Book Sluggish: Businesses were “hesitant to hire” because of weaker sales and uncertainty tied to U.S. trade wars, the Federal Reserve said last Wednesday in its monthly Beige Book. Tariffs have only exacerbated inflation by a “moderate or modest amount” so far. These findings in the Fed’s periodic view of the economy, known as the Beige Book, probably won’t sway top officials when they meet in two weeks to vote on whether to lower interest rates. Investors widely expect the central bank to cut rates this month to help support the labor market. Fed officials were already worried about a slowdown in hiring and this region-by-region Fed survey does nothing to dispel those concerns. The latest beige book covers the six weeks up to August 25.

Call me if you have any questions. I am always happy to help!

John J. Gardner, CFP®, CPM®.

Blackhawk Wealth Advisors, Inc.

3860 Blackhawk Rd. Ste. 160 Danville, CA. 94506

Phone: 888-985-PLAN · Email: jg@blackhawkwealthadvisors.com

BLACKHAWKWEALTHADVISORS.COM

For my Quarterly Market Focus podcast, click on the link below. I provide a recap of market action in the quarter just passed with a focus on the stock market’s highlights and then a look forward to the quarter ahead with some insights and perspectives that I hope will help you with what to expect in the next 90 days.

810c9060-6bc9-4e20-948f-60bee7c1b0be image
dc6d6594-dfce-48b0-8d69-3a27db12748d image
7d2eabf6-51c8-425f-b667-128ed7bc0dd2 image

Blackhawk Wealth Advisors is the parent corporation of Equity Research & Portfolio Evaluation and Blackhawk Asset Management. Its founder and President is John J. Gardner. John is a Certified Financial Planner (CFP®) and Certified Portfolio Manager (CPM®). As an AIF®, John is also an Accredited Investment Fiduciary.

CUSTOMIZED. STRATEGIC. DYNAMIC.