ERPE Excerpts 8.28.25 Bitcoin

Bi-MONTHLY MARKET ANALYSIS &

ECONOMIC UPDATES

August 28, 2025

Bitcoin

Cryptocurrency as an Asset Class

Bitcoin is a type of digital currency, known as a cryptocurrency. It was created in 2009 by an anonymous source using the pseudonym Satoshi Nakamoto. The Bitcoin cryptocurrency operates on a decentralized technology called blockchain, which is a public ledger of all transactions. This means it isn’t controlled by any government or bank, making it a peer-to-peer system for transferring value. People use bitcoin for buying goods and services, investing, and as a store of value. Its value has fluctuated significantly, as like anything else sold, is based on market demand. The supply side of the valuation equation is one unique feature of bitcoin. Its supply is limited. Bitcoin has a fixed supply of 21 million coins, which can help preserve its value over time. Over the past 16 years, bitcoin has grown from an unproven idea into a $2.4 trillion asset that is increasingly owned by some of the most respected investors in the world.

In recent years, bitcoin has emerged as a bona fide institutional asset. What was once a niche alternative asset owned mostly by retail investors is now broadly discussed and analyzed by the largest institutional financial firms around the world, and increasingly held by hedge funds, pensions, corporations, and sovereign wealth funds. The primary catalyst of broader ownership was the launch of spot bitcoin exchange-traded products in the U.S. in January 2024, which made accessing bitcoin safer, easy, and inexpensive for traditional investors. But the transformation has accelerated because of multiple factors, including the pro-crypto regulatory shift in the U.S. following last year’s presidential election. In January and March 2025, President Trump signed executive orders to make the U.S. the “crypto capital of the world”. The administration has voiced strong support for domestic Bitcoin mining. Trump has publicly stated that he wants “all the remaining Bitcoin to be MADE IN THE USA,” framing it as a national security issue. In July, President Trump signed the GENIUS Act into law. This is considered a broad victory for the crypto industry, providing regulatory certainty and creating the first federal framework for the asset class.

As bitcoin makes this transition to a more widely owned asset, there will be greater demand for long-term capital market assumptions. These robust, data-driven estimates of future returns, volatility, and correlations help investors model the role of bitcoin in portfolios. Here are some assumptions and investment perspectives that relate to bitcoin investing.

Capital Gain Assumptions

Return expectations are often expressed in terms of ROI (return on investment) over a period of time or as a CAGR (compounding annual growth rate), both stated in percentages. Due to the unique supply/demand dynamics of bitcoin, some analysts and experts often have varying outlooks, with some projecting future CAGR ranging from 20% to over 50% – depending on adoption rates, regulatory environments, and macroeconomic factors – over the next 10 years. Of course, demand and supply for the cryptocurrency will determine bitcoin’s future value.

Demand

While retail investors led its emergence, institutional investors are likely to maintain the highest demand for bitcoin going forward. The challenge, though, is approximately 95% of all the bitcoin that will ever exist is already owned — primarily by retail investors. So, institutional investors will have to buy bitcoin from existing investors. Even conservative demand assumptions from these investors – between 1% to 5% of their total assets – amounts to trillions of dollars. The World Bank believes that institutional investors control roughly $100 trillion in total assets. In the coming decade, that could mean investing $1 trillion to $5 trillion in bitcoin.

Supply

I noted above that there is a finite number of bitcoins. As of today, approximately 19.4 million Bitcoin have already been mined out of the total supply cap of 21 million. This means around 92-93% of all Bitcoin that will ever exist has been mined. Bitcoin’s supply is inelastic: No amount of demand for bitcoin or change in its price will cause more bitcoin to be produced, unlike gold, oil, or other major commodities.

Investment Perspective

A common question critics ask about bitcoin is: Why does it have any value? After all, bitcoin does not generate cash flows. In the view of bitcoin and cryptocurrency experts at Bitwise, the answer is… bitcoin as is a service. It has the ability to store wealth in a digital format without relying on a bank or a government. The more people who want this service, the more valuable bitcoin becomes. The fewer people who want this service, the less valuable bitcoin becomes. If no one wants this service, the value of bitcoin is zero. This is no different from any other service. The difference lies in how that value accrues. Using traditional software providers as an example, users who want that service pay an annual subscription fee to the company. With bitcoin, you can’t pay a subscription fee. After all, there is no “Bitcoin Company.” Instead, the only way to get the service is to buy bitcoin. If you buy bitcoin, you get the service—the ability to store wealth in a digital format without a bank.

Risk

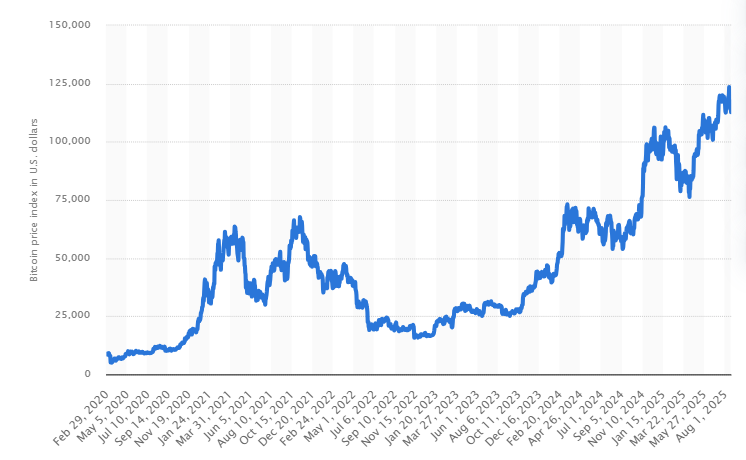
Historically, bitcoin has been a spectacular investment. The chart below shows its great gains since 2020. Like all investments, bitcoin certainly is not without risks. Bitcoin’s price can fluctuate wildly in a short period, leading to potential losses. Given its speculative nature, relying solely on price speculation without understanding the underlying technology or market trends increases risks associated with bitcoin. A unique risk to bitcoin is technological risk. Undiscovered flaws or future technological changes could render Bitcoin less useful or even obsolete.

TAKING PERSPECTIVE…

Proper Perspective:  In our hectic and often hard to comprehend world, it is very easy to lose perspective. You may agree it is sometimes difficult to see the big picture. The media often doesn’t help with this, but unfortunately instead encourages us to see things in a most negative light. Here is hopefully a pause to gain positive perspective.

Famous Quote On This Day:  “If there hadn’t been an Elvis, there wouldn’t have been the Beatles.”

~~ John Lennon, 1965

What Happened On this Day August 28, 1939 –  The world’s first jet aircraft, Heinkel He 178, took its first flight.

MARKET ANALYSIS

INDICATORS OF INTEREST:

  • Market’s Current Signal: Confirmed Uptrend.  Analysis of the stock market over 130 years of history shows we can view it in terms of three stages -market in uptrend, uptrend under pressure and market correction.  Since the 1880’s, this perspective has led to investment out-performance relative to market indexes. This is due to trend analysis which determines risk reducing, return enhancing market entry and exit points. The U.S. stock market’s current signal indicates the market is in Confirmed Uptrend. That officially happened April 22 and is still intact. This has been the fastest market rebound from a bear market low in history. The uptrend continues.

The Stock Market Trend: Confirmed Uptrend.  The stock market powered higher Tuesday, April 22 and the Nasdaq and S&P 500 confirmed new rally attempts. That follow-through signaled a Confirmed Uptrend. In late June the major stock market indexes reclaimed levels set in late February and significantly above the pre-“Liberation Day” level. Today the major indexes are at new all-time record highs. Here’s a quote from a market analyst yesterday, “Another day, another new high.” Yesterday was the 19th of 2025 for the SP 500.

Here are key market levels as of Monday, August 25

Recapping Last Week

U.S. equity indices finished the week on a strong note, while Treasury yields and the U.S. dollar index tumbled after Federal Reserve Chair Powell signaled that the central bank is likely ready to resume interest rate cuts next month. The S&P500 index overcame earlier weakness caused by retailers’ mixed earnings reports to finish marginally higher while the Nasdaq Composite fell 0.5%, dragged down by concerns around artificial intelligence-related valuations. The Russell 2000 soared nearly 4% on Friday as smaller companies with higher debt loads may benefit from looser Fed policy. Has J. Powell turned dovish? Economically sensitive cyclical sectors also posted solid returns for the week. Commodities like gold and oil rose on the prospects of lower rates and a weaker dollar, while Ethereum rocketed 9% to a new record high. In his speech at Jackson Hole, Powell said that “with policy in restrictive territory, the baseline outlook and the shifting balance of risks may warrant adjusting our policy stance.” Odds for a September rate cut—which had fallen below 70% before the speech—jumped to over 90% before settling near 83%. Two-year Treasury yields slid to 3.69% while the 10-year closed near 4.26%. Powell stated that downside risks to employment have risen but also cautioned that the central bank must still guard against the inflationary effects from tariffs. While not exactly dovish, the speech was less hawkish than investors had feared. He also outlined changes to the Fed’s monetary policy framework, removing language about the pre-2021 low-rate environment and returning to flexible inflation targeting. In other economic news, U.S. manufacturing expanded this month at its fastest rate in over three years, with stronger demand also triggering pricing pressures. The S&P Global flash manufacturing PMI jumped to 53.3 while services eased slightly to 55.4. U.S. housing starts and permits rose in July despite high mortgage rates and an uncertain economy, while the growing supply of existing homes took some pressure off home prices. Retailer Home Depot missed expectations for quarterly revenue and profit but did not lower its future guidance. Walmart raised its sales and earnings forecast, noting that thus far, the tariff impact has been gradual enough not to have changed customer habits.

Overseas, businesses in Germany and the wider Eurozone saw new orders increase for the first time in over a year, pushing the flash manufacturing PMI to its highest level in more than three years. British composite PMI surged to 53.0, but inflationary pressures returned as CPI jumped to 3.8% YoY in July from 3.6%. Services inflation spiked to 5% YoY, likely pushing back any chance of further rate cuts to spring 2026 at the earliest. Finally, Japan’s core CPI slowed to 3.1% YoY last month as food prices continued to ease.

Current View

The S&P 500 hit another record high yesterday. Its 19th of the year. With the three-day Labor Day holiday weekend coming up, it is to expected that volume would lighten up. This is the case as of yesterday and today. Yet earnings announcements have market participants paying close attention to specific stocks, even if they are away from their desks. Yesterday’s post-close reports from a hand full of AI related tech stocks, led by Nvidia, were highly anticipated. They did not disappoint, as acceleration in the businesses continues in both AI software and hardware.   Judging by the stock market action, it seems Wall Street is projecting a view that the elements of a bull run are still intact.

  • Industry Group Strength:  BULLISH. As of yesterday, 124 out the 197 groups I monitor are up year-to-date. 73 groups are down for the year.
  • New Highs vs. New Lows:  BULLISH. In yesterday’s session, there were 329 new 52-week highs and 19 new 52-week lows.
  • Dow Dividend Yield:  BEARISH. The current yield for the Dow Jones Industrial Average is 1.85%. The 10-year Treasury now 4.22%.
  • Volatility Index: BEARISH. Volatility has been volatile. The “VIX” is now about 14, down from 15 two weeks ago. The index is also known as the “Fear Index.” It is considered a contrarian indicator and therefore viewed as bullish as it rises indicating investors are becoming more fearful. The VIX:
  • Fear / Greed Index: BEARISH.  Investors are driven by two emotions: fear and greed. Too much fear can create a condition of oversold/ undervalued stock prices. Too much greed can result in overbought/overvalued stock prices. The AAII Investor Sentiment Index is now neutral.   BE FEARFUL WHEN OTHERS ARE GREEDY. At 62, the Fear & Greed Index is down from 64 two weeks ago.

CLICK VIDEO FOR MORE ON THE “FEAR & GREED INDEX”

How CNNMoney’s Fear & Greed Index works

  • Bull / Bear Barometer:  BEARISH. This secondary market indicator should also be viewed with a contrarian perspective. As of yesterday, according to the latest survey of stock market newsletter writers by Investor’s Intelligence, the bullish tally is 51% about the same as two weeks ago. The bears are 17.6%, down from 21.2 two weeks ago. Consider this a contrarian indicator because the crowd is often wrong at market tops and bottoms. In other words, extreme bullishness has been seen near several market tops in the past, while extreme bearishness has been seen at market bottoms.
  • Put / Call Ratio:  NEUTRAL. The ratio of put-to-call options is 0.68, down from 0.76 two weeks ago. The put-call ratio tracks the mood of what options investors are doing, not just saying. They typically buy puts if they think a stock will decline and calls if they think it will rise. If they’re buying lots of puts, they see the market declining. And if they’re loading up on calls, they’re generally bullish. Historically, market bottoms occurred when the reading spikes to 1.2 or more. Market tops are often made when the reading is 0.6 or less. Note how reliable this is with respect to the February record low coinciding with the market high. Keep in mind this is also a contrarian indicator.

ECONOMIC UPDATES

Global Economic Indicators & Analysis:

POSITIVE INDICATORS

Jobless Claims Down: Initial unemployment-benefits claims fell in the latest week, easing concerns that a spike in the prior week was the start of a higher trend. First-time jobless claims fell by 5,000 to 229,000 in the week ended Aug. 23, the Labor Department said today. The drop was in line with the forecasts of Wall Street economists surveyed by the Wall Street Journal. The number of people already collecting unemployment benefits in the week of August 16 fell by 7,000 to 1.95 million, the government said. These so-called continuing claims have been trending higher this year, a sign that laid-off workers are having trouble finding new jobs.

GDP Revised Up:  Real gross domestic product (GDP) increased at an annual rate of 3.3% in the second quarter of 2025 (April, May, and June), according to the second estimate released by the U.S. Bureau of Economic Analysis today. Real GDP was revised up 0.3 percentage point from the advance estimate, primarily reflecting upward revisions to investment and consumer spending that were partly offset by a downward revision to government spending and an upward revision to imports.

Home Builder’s Confidence Up: Confidence among home builders ticked down in August as home-buying demand remains weak, and builders are throwing more sales incentives at buyers to boost sales. Builders’ sentiment in the market fell in August from the month before. Sentiment was glum as builders face weak demand as well as challenges associated with developing land and building homes. The National Association of Home Builders’ monthly confidence index fell in August to 32, the industry group said last Monday . A year ago, the index stood at 39. Persistently high mortgage rates and home prices are keeping buyers away from the market. But that is likely to change soon.

WEAK INDICATORS

LEI Down:  The Conference Board Leading Economic Index (LEI) for the US inched down by 0.1% in July 2025 to 98.7, after declining by 0.3% in June. This report was released last Thursday. The LEI fell by 2.7% over the six months between January and July 2025, a faster rate of decline than its –1.0% contraction over the previous six-month period (July 2024 to January 2025). The Board’s lead economist said, “While the LEI’s six-month growth rate remains negative, it improved slighlty in July—but not enough to avoid triggering the recession signal again. Despite that, The Conference Board does not currently project a recession, though we do expect the economy to weaken in H2 2025, as the negative impacts from tariffs become more visible. Overall, real GDP is projected to grow by 1.6% year-over-year in 2025, before slowing in 2026 to 1.3%.”

Consumer Confidence Down:  According to the Conference Board Tuesday, a measure that looks at how consumers feel about the economy right now fell by 1.6 points to 131.2. A confidence gauge that looks six months ahead slipped by 1.2 points in August, to 74.8. Consumers’ appraisal of current job availability declined for the eighth straight month. The survey’s so-called labor-market differential, derived from data on respondents’ views about whether jobs are plentiful or hard to get, fell to 9.7. That was the lowest since February 2021 and was down from 11.3 in July. Overall, the headline consumer-confidence index reading fell to 97.4 in August from a revised 98.7 in the prior month, the Conference Board said.

Durable Goods Orders Down:  Orders for long-lasting goods fell 2.8% in July, dragged down by weak sales of commercial aircraft, the Commerce Department said Tuesday. It is the third drop in the past four months. Economists had forecast a 4.0% drop in orders for durable goods — products made to last at least three years. The report looked stronger beneath the surface. Excluding transportation, durable-goods orders rose 1.1%. That beat expectations of a 0.1% gain. Economists said the tax bill passed by Congress this summer might spark orders in the coming months.

Call me if you have any questions. I am always happy to help!

John J. Gardner, CFP®, CPM®.

Blackhawk Wealth Advisors, Inc.

3860 Blackhawk Rd. Ste. 160 Danville, CA. 94506

Phone: 888-985-PLAN · Email: jg@blackhawkwealthadvisors.com

BLACKHAWKWEALTHADVISORS.COM

For my Quarterly Market Focus podcast, click on the link below. I provide a recap of market action in the quarter just passed with a focus on the stock market’s highlights and then a look forward to the quarter ahead with some insights and perspectives that I hope will help you with what to expect in the next 90 days.

810c9060-6bc9-4e20-948f-60bee7c1b0be image
dc6d6594-dfce-48b0-8d69-3a27db12748d image
7d2eabf6-51c8-425f-b667-128ed7bc0dd2 image

Blackhawk Wealth Advisors is the parent corporation of Equity Research & Portfolio Evaluation and Blackhawk Asset Management. Its founder and President is John J. Gardner. John is a Certified Financial Planner (CFP®) and Certified Portfolio Manager (CPM®). As an AIF®, John is also an Accredited Investment Fiduciary.

CUSTOMIZED. STRATEGIC. DYNAMIC.