

DOW Soars Over 600 Points
The last 4 “Market Updates” I sent were on severe sell-off days. They were all down. On October 5th, I penned an update underscoring the beginning of sharp downtrend highlighted by the NASDAQ falling about 3.5% in 2 days. Then on October 11th I wrote to share my insights on why all the major U.S. stock indexes had dived 3%. Just 9 business days later, on October 24th, I sent an update describing how the market correction had intensified. Not today. Today’s Market Update is a good one. The positive market action today changes the narrative a lot. With the DOW soaring over 600 points on heavy volume, constructive patterns replaced correction trends.
 |
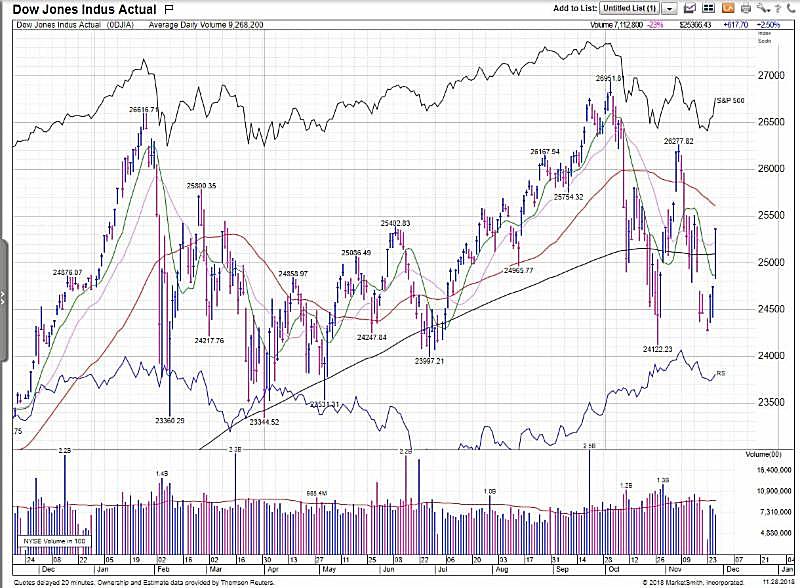
The chart above of the DOW tells the story best. Note the black horizontal line on the chart in the price area. That is a 200-day moving average of the Dow Jones 30 index over the last year. Today’s gain resulted in the DOW recapturing that trend line as it jumped 2.5%.
The stock market’s move higher today marked its third straight advance, following a more dovish tone from Fed Chairman Jerome Powell. Wall St. may get what it has been wishing for: a “one-and-done” move from the Federal Reserve regarding interest rates. A December rate hike is “baked-in”, as it is all but done. The Fed’s hint at raising rates three more times next year is now in question. Powell told the Economic Club of New York that interest rates are “just below” neutral, suggesting fewer Fed rate hikes ahead. In early October, the Fed chair had called rates a “long way off” from neutral. The major market indexes, already higher ahead of his speech, took off and didn’t look back. The Nasdaq surged 2.9%, the S&P 500 rallied 2.3%, and as noted above, the DOW gained 2.5%. Small caps also participated as the Russell 2000 rallied 2.5%. Volume was higher across the board.
Investors are wondering whether this week’s rebound in stocks is just another “dead cat bounce” in a new, downward trending market, or if a near term bottom is forming and stocks are poised to rally back towards the September highs. While no one knows the answer to that question for sure, the technical backdrop and internals of the stock market can offer clues during times of elevated volatility and those insights. Stock market technicals have undoubtedly deteriorated over the last several weeks as the bout of volatility that began in early October continued. However, digging into specific levels in each of the major indexes, there are still some notable support levels holding. Today’s DOW chart is evidence.
What now?
With the bulk of the selling pressure being in tech, the NASDAQ is arguably the most important index to be watching right now, and it also has held key support from early 2018. That support zone spans from 7015 down to 6875. The Nasdaq had a relatively more optimistic close on Friday, ending further off the lows than the broader S&P, but that is a good thing given the fact that it has been leading the broad market lower over the last few weeks. While today’s near 3% pop was healthy, there is much more healing for the NASDAQ to do. Now that the grip of fear from higher interest rates has lightened, the market will focus more earnings. Today’s market reaction to a strong earnings report from Salesforce.com, a core hold in BAM’s Thematic Growth portfolio, shows the impact of earnings. Salesforce stock shot-up over 10% today.
With the tail winds of today’s strong market move, the trend of the U.S. stock market has again turned positive to “Market in Confirmed Uptrend”.
Thank you for your continued trust and confidence. I remain vigilant as I manage and oversee your investment account.
Please call anytime you have a question or I may be of help. I am always happy to be of service.
Sincerely,
John