


Bi-Monthly ERPE Excerpts for September 28, 2023
Bi-MONTHLY MARKET ANALYSIS &
ECONOMIC UPDATES
September 28, 2023
Q4 Recovery? History says…

Through July 31, investors were convinced that nothing could derail this market’s advance. In a Letter to Clients in early July, “After a strong first half, the stock market remains in Confirmed Uptrend” , I noted it was a fantastic first half. By the end of July the S&P Composite 1500 had jumped nearly 19%, boosted by gains from all sizes and styles, nine of 11 sectors, and 70% of its sub-industries. Then, as if on cue with the “seasonal stock market calendar”, the S&P 1500 got hit by August and September. Since July 31, the S&P 1500 has declined more than 6% through last week. Concerns over “higher for longer” interest rates, continued strength in the jobs market, rising oil prices, a strengthening U.S. dollar, worry of a U.S. government shutdown and weakness in China, to name a few of the biggies, has flipped the stock market’s trend from “Confirmed Uptrend” to “Market in Correction”. All sizes, styles, 10 of 11 sectors, 82% of all subindustries, and 83% of all companies in the S&P 500 have fallen in price. As a result, it’s not surprising that investor sentiment is down and investor FUD (fear, uncertainty & doubt) is up.
There is potential good news, though. That is, if history is on our side. Stock market history points to better days ahead through year end. So, a Q4 market rally may be in store for investors. The S&P 500 gained an average 5.0% during the fourth quarter of all years since 1990, rising in price 82% of the time. In addition, all sizes, styles, and sectors posted average advances from 2.1% to 6.4%. Market leadership has come from the industrials, materials, and tech sectors, while energy and utilities were weak. If this repeats, it would be a sharp reversal from the recent strength in the energy group as oil has run up recently to over $94 a barrel. Factors for a Q4 rally this year could come from the conclusion of hikes and strikes, as well as the projected recovery in S&P 500 earnings growth for the remainder of the year and into 2024. As history has shown, I see the more growth-oriented groups outperforming the defensive sectors. But, we may find that the best offense is a good defense, so let’s stay diversified!
TAKING PERSPECTIVE…
Proper Perspective: In our hectic and often hard to comprehend world, it is very easy to lose perspective. You may agree it is sometimes difficult to see the big picture. The media often doesn’t help with this, but unfortunately instead encourages us to see things in a most negative light. Here is hopefully a pause to gain positive perspective.

Famous Quote For Today: “It seems still more impossible that a quarrel which has already been settled in principle should be the subject of war.”
~~Neville Chamberlain, 1938
What Happened On This Day, September 28, 1954 – The Tonight Show is debuted nationwide on NBC hosted by Steve Allen.
MARKET ANALYSIS
INDICATORS OF INTEREST:
- Market’s Current Signal: Market in Correction. Analysis of the stock market over 130 years of history shows we can view it in terms of three stages – market in uptrend, uptrend under pressure and market correction. I analogize this to a traffic signal’s changing colors from green to yellow and then to red. Since the 1880’s, this perspective has led to investment out-performance relative to market indexes. This is due to trend analysis which determines risk reducing, return enhancing market entry and exit points. The U.S. stock market’s current trend signal is Market in Correction.
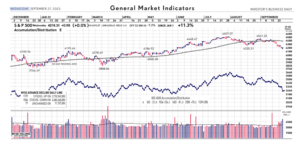
The Stock Market Trend: Market in Correction. The U.S. stock market was trending in a Confirmed Uptrend from May 10 to August 2. A steep, broad and high volume bearish sell-off on that day caused a weaker stock market trend outlook to Uptrend Under Pressure. Continued persistent selling triggered a more bearish signal, knocking the market’s trend into Correction on August 17. A 3-week losing streak came to sudden stop as the resilient market showed strength again, resulting in another trend change back to Confirmed Uptrend Tuesday, August 29. That didn’t last long. On September 7 the stock market’s trend signal weakened to Uptrend Under Pressure. Then multiple days of high volume down days lead to a further weak trend signal on the 20th to Market in Correction.
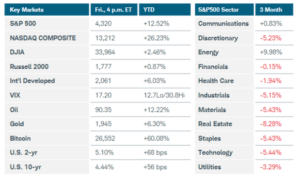
Here are key market levels as of Monday, September 25:
Recapping Last Week
U.S. equity indexes sank to a third straight week of losses after the Federal Reserve suggested another interest rate hike this year is likely, along with plans to hold rates higher for longer than previously anticipated. The Nasdaq Composite and Russell 2000 Indexes plummeted over 3.5%, while the S&P500 dropped nearly 3%. All 11 S&P500 sectors were lower, paced by about 6% plunges in real estate and consumer discretionary. U.S. Treasury yields spiked to 16-year highs the day after the Fed released its quarterly SEP (Summary of Economic Projections), where 12 of 19 officials see more tightening this year and rates at 5.1% in 2024, versus 4.6% in June’s projection. The Fed also sees stronger economic growth and employment than initially expected. In his press conference, Chair Powell wouldn’t commit to a “soft landing” as the base case, saying that a stronger economy ― rather than concerns of an inflation cooldown stalling ― would mean the Fed’s work with interest rates is not done. The U.S. dollar posted its tenth straight week of gains, keeping commodity prices in check. In other news, stubbornly high mortgage rates dented U.S. homebuilder confidence in September, and new home construction plunged 11.3% month-over-month in August. Manufacturing activity in the Philadelphia region contracted in September, while U.S. flash PMIs showed little change but stayed in expansion territory despite new orders sliding. Employment remained strong, with weekly jobless claims falling to an eight-month low of 201,000.
Internationally, the Bank of England surprisingly reversed course, holding rates steady by a slim 5-4 vote after the prior day’s inflation report was cooler than expected. The UK’s composite PMI sank to 46.8 in September, flashing recession signals. The Bank of Japan maintained its ultra-loose policy, citing “extremely high uncertainties” on the global growth outlook. Finally, the manufacturing sector contraction deepened in Germany and the Eurozone for September, with data revealing a sustained decline in demand that pointed to a recession for the third quarter.
Current View
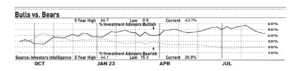
A week after a downshift in the market’s trend to correction mode, the health of stocks hasn’t improved much at all. Yet indexes reversed off their intraday lows in the stock market yesterday, hinting that institutional-class investors sought bargains. However, six of the 10 biggest advancers hailed from the oil and gas patch. They included international and U.S. oil and gas exploration firms, as well as stocks in oil field services, drilling and machinery. These industry groups each rose at least 3% yesterday. Oil futures gained more than 2% and hit as high as $94.14 a barrel yesterday – the highest level since late August of 2022. Not just is oil up, but so are bond yields and the dollar. The yield of the U.S. Treasury 10-year bond rose sharply yesterday, up as much as 8 basis points to 4.64% before settling at 4.62%. That marked the highest point since October 2007. The U.S.dollar is at its highest level in 20 years against other major currencies. Yesterday it topped a 1-year high against the Japanese Yen. One indicator that is down is investor sentiment. Negative, or bearish, investor’s feelings about the stock market can be positive, or bullish, if negative enough. This is a contrarian concept. The latest Investors Intelligence survey of newsletter editors shows bulls tanked to 43.7% from 48.6% a week ago. It’s now close to hitting the late-August level of 43.1% and down significantly from a peak of 57.1% reached earlier that same month. Meanwhile, bears rose mildly to 23.9% vs. 22.8% last week. Getting close to extreme investor pessimism, which should give you more optimism.
- Industry Group Strength: BULLISH. As of yesterday, 116 out the 197 groups I monitor are up year-to-date. 81 are down.
- New Highs vs. New Lows: BEARISH. In yesterday’s session, there were 57 new 52-week highs and 502 new 52-week lows.
- Dow Dividend Yield: BEARISH. The current yield for the Dow Jones Industrial Average is 2.26%. The 10-year Treasury now 4.61%.
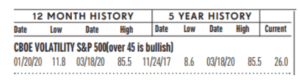
- Volatility Index: BEARISH. Volatility has been volatile. The “VIX” is now 18, up from 13 two weeks ago. The index is also known as the “Fear Index.” It is considered a contrarian indicator and therefore viewed as bullish as it rises indicating investors are becoming more fearful. The VIX:
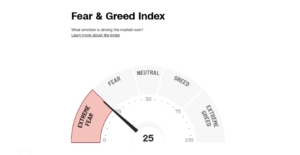
- Fear / Greed Index: Bullish. Investors are driven by two emotions: fear and greed. Too much fear can create a condition of oversold/ undervalued stock prices. Too much greed can result in overbought/overvalued stock prices. The AAII Investor Sentiment Index is now neutral. BE FEARFUL WHEN OTHERS ARE GREEDY. At 25, the Fear & Greed Index is down from 55 two weeks ago.
- Bull / Bear Barometer: NEUTRAL. This secondary market indicator should also be viewed with a contrarian perspective. As of yesterday, according to the latest survey of stock market newsletter writers by Investor’s Intelligence (see below), bullish sentiment is 43.7% and the bears came in at 24%. Bulls are down from 50.7% two weeks ago and the bears are up from 22.5% Consider this a contrarian indicator because the crowd is often wrong at market tops and bottoms. In other words, extreme bullishness has been seen near several market tops in the past, while extreme bearishness has been seen at market bottoms.
- Put / Call Ratio: BEARISH. The ratio of put-to-call options is 0.75, up from 0.55 two weeks ago. The put-call ratio tracks the mood of what options investors are doing, not just saying. They typically buy puts if they think a stock will decline and calls if they think it will rise. If they’re buying lots of puts, they see the market declining. And if they’re loading up on calls, they’re generally bullish. Historically, market bottoms occurred when the reading spikes to 1.2 or more. Market tops are often made when the reading is 0.6 or less. Note how reliable this is with respect to the February record low coinciding with the market high. Keep in mind this is also a contrarian indicator.

ECONOMIC UPDATES
Global Economic Indicators & Analysis:
POSITIVE INDICATORS
Durable Goods Orders Up: Orders for long-lasting or durable goods rose a stronger-than-expected 0.2% in August, but the increase stemmed from higher defense spending as the U.S. sought to replenish military hardware sent to Ukraine. Economists polled by the Wall Street Journal had forecast a 0.5% decline. Durable-goods orders minus defense actually fell 0.7% last month, the government said yesterday. The big uptick in core orders was somewhat of a surprise, but it remains to see if the increase is sustained. The industrial side of the economy is likely to tread water for a while. Interest rates are expected to remain high into next year, reducing demand for big-ticket items and keeping the threat of a recession elevated.
Empire State Index Up: The New York Fed’s Empire State business conditions index, a gauge of manufacturing activity in the state, rose 21 points in September to 1.9, the regional Fed bank said last Friday. The gain reverses a 20.1 point drop in August. Any reading above zero indicates improving conditions. The Empire State index has been volatile this year, twice falling below negative 30 before recovering. Economists use the regional Fe data to get an early read on overall factory conditions in the country.
Industrial Output Rises: Industrial production rose 0.4% in August, the Federal Reserve reported last Friday. Capacity utilization rose to 79.7% in August from 79.5% in the prior month. The capacity-utilization rate reflects the limits to operating the nation’s factories, mines and utilities. Higher borrowing costs and weaker demand for goods are headwinds for manufacturing. However, a stabilization in demand at lower levels coupled with onshoring and infrastructure spending could be positive for factory activity over coming months.
Fed Pause: Last Wednesday, the Federal Reserve engineered a hawkish pause, holding interest rates steady while indicating a majority of officials expect one more quarter-point interest rate hike before the end of the year. At the same time, the Fed sent a clear message that interest rates were expected to be “higher for longer” by cutting its forecast for rate cuts in 2024 from four to two. As a result, officials see their benchmark rate rate still slightly above 5% by the end of next year. After today’s decision, the Fed’s benchmark rate remains in a range of 5.25% to 5.5%. The vote to hold rates steady was unanimous. According to the Fed’s dot-plot forecast, 12 Fed officials penciled in another 25 basis point rate hike this year, while seven projected no more more hikes. Fed Chairman Jerome Powell said a hike will depend on the economic data. The Fed next meeting on October 31- November 1.
WEAK INDICATORS
Jobless Claims Up: The number of Americans who applied for unemployment benefits rose slightly last week to 204,000, but layoffs remained extremely low and there was no sign of rising unemployment. New jobless claims edged up from a revised 202,000 in the prior week, the government said today. Economists had forecast new claims in the week ended Sept. 23 to total 214,000.Claims show a very low number of job losses, indicating the economy is still on firm ground.
GDP Unrevised – Consumer Spending Down: The U.S. economy grew at a solid 2.1% annual pace in the second quarter, today’s revised figures show, but consumer spending turned out to be weaker than originally reported. The increase in household spending was chopped to 0.8% from a prior estimate of 1.7%. Consumer spending is the main engine of the economy. Yet more recent evidence suggests consumer spending rebounded in the third quarter, as did the broader economy. GDP is forecast to rise 4% or more in the third quarter running from July to September. The second-quarter estimate was unchanged from the prior 2.1% reading.
LEI Falls Again: The leading economic index fell 0.4% in August and declined for the 17th month in a row, but there’s still no sign the U.S. is headed for a recession. The leading index is a gauge of 10 indicators designed to show whether the economy is getting better or worse. Last Thursday, the Conference Board said six of the 10 components dropped in August. Historically, a big losing streak portends an approaching recession. Yet the economy has continued to expand and many forecasters have dropped their call for a recession. Many economists have backed off longstanding predictions of recession or have pushed out a target date until next year.
S&P Flash Survey Shows Slowing Economy: The U.S. economy lost some momentum toward the end of summer as rising interest rates and still-high inflation took a bite out of growth, a pair of S&P surveys showed. The S&P Global surveys are among the first indicators each month to provide an assessment of the health of the economy. Any number above 50 signals expansion, while numbers below 50 point to contraction. One caveat: The S&P surveys have consistently shown the economy to be weaker than other measures of U.S. growth. New orders, a sign of future demand, fell at the “strongest pace this year,” S&P said. The survey added to concerns regarding the trajectory of demand conditions in the U.S. economy following interest-rate hikes and elevated inflation.
More Rate Hikes? : Several senior Federal Reserve officials last Friday said the U.S. central bank might not be done raising interest rates and that rates are likely to stay “higher, and for longer, than previous projections had suggested.” Last Wednesday, the Fed left its short term interest rate unchanged at a range of 5.25% to 5.5%, yet the Fed left open the door for another rate hike before year end if inflation doesn’t slow further toward the Fed’s 2% target. The current rate of inflation is about twice as high. In their most recent forecast, 12 of the 19 top officials predicted one more rate hike this year. Seven thought rates were already as high as they needed to go.
Consumer Sentiment Down – Again: A survey showed consumer sentiment falling in September for the second month in a row as Americans expressed more worries about the economy, but it found that they also think inflation will continue to slow. The preliminary reading of the sentiment survey dropped to 67.7 this month from 69.5 in August, the University of Michigan said last Friday. The index had hit a 22-month high in July before backtracking. The consumer-sentiment survey reveals how consumers feel about their own finances as well as the broader economy. Americans are of two minds. They think the economy is doing OK, especially because of a strong job market and low unemployment. But they also worry that higher interest rates and lingering inflation could eventually hurt the economy.
Home Builder Confidence Sinks: Builder confidence fell in September to the lowest level in 5 months as buyer demand waned on the back of persistently high mortgage rates. Buyers are struggling with rates over 7% and are choosing to wait until they drop, which pushed the National Association of Home Builders’ monthly confidence index down 5 points to 45 in September. This is the second month in a row that sentiment has dropped among builders. A year ago, the index stood at 46. Builders are boosting sales incentives to attract buyers who are sitting on the sidelines, waiting out high rates. High mortgage rates are clearly taking a toll on builder confidence and consumer demand, as a growing number of buyers are electing to defer a home purchase until long-term rates move lower.
US Home Sales Fall: U.S. home sales in August fell to the lowest level since January 2023. A low number of home listings and high interest rates brought down sales of previously owned homes, which fell by 0.7% to an annual rate of 4.04 million in August, the National Association of Realtors said last Thursday. Home buyers today are facing an unfriendly housing market, due to the twin challenges of high mortgage rates and low inventory. Competition for a limited number of listings, along with rising home prices and higher borrowing costs, are making homeownership much more expensive and slowing the sector.
US Housing Construction Falls: Construction of new U.S. homes fell 11.3% in August — falling short of Wall Street expectations — as builders scaled back new projects to focus on completions. The pace of construction reversed course and fell as mortgage rates stayed over 7%, dampening home-buying demand. The last time construction of new homes was at this level was in June 2020. So-called housing starts fell to a 1.28 million annual pace from 1.45 million in August, the government said Tuesday. That’s how many houses would be built over an entire year if construction took place at the same rate every month as it did in August. New homes have dominated the housing market, but persistently high rates are beginning to spook home builders.
Cost of Imports Spike: The cost of imported goods rose 0.5% in August, marking the biggest increase in 15 months, largely because of higher oil prices. A late-summer surge in oil prices tied to Saudi Arabian production cuts has nudged U.S. inflation higher, at least for now. Before the recent spike in energy prices, inflation has been on a downtrend. The recent increase in prices shows that inflation is unlikely to return to pre-pandemic levels of 2% or less anytime soon.
Call me if you have any questions. I am always happy to help!
John J. Gardner, CFP®, CPM®.
Blackhawk Wealth Advisors, Inc.
3860 Blackhawk Rd. Ste. 160 Danville, CA. 94506
Phone: 888-985-PLAN · Email: jg@blackhawkwealthadvisors.com
BLACKHAWKWEALTHADVISORS.COM
For my Market Monthly podcast, click on the link below. I provide a review of global stock market highlights over the past month and preview of the month ahead. Forward insights and perspectives are based on current financial market and economic trends with an emphasis on relevant developments in various areas from Fed policy to company earnings announcements.
Link to my Market Monthly Podcast