


ERPE Excerpts
Bi-MONTHLY MARKET ANALYSIS &
ECONOMIC UPDATES
September 14, 2023
How to Invest in AI
Stocks Leading the AI Revolution

A work day has not gone by this year, truly, that I have not heard or read about “AI”. Just Yesterday tech leaders gathered on Capital Hill to discuss the future of AI. The agenda was to focus on potential regulations and what’s at stake in the AI revolution. Tuesday I heard a curious news story about Coca-Cola’s announcement of an “AI-Inspired” new drink as its latest “creation”. No kidding. It’s called ‘Y3000 Zero Sugar”. Coke’s wants to celebrate an optimistic vision of the future. A can of Y3000 actually says, “Futuristic Flavored”. Really?? How about Monday? “AI” was mentioned maybe 50 times in an article I read about “AI Stocks”. On company earnings calls, which I listen to many, management teams mention artificial intelligence dozens of times. AI is already the most written about topic among my over 22 years of ERPE Excerpts. Today’s Excerpts is the 5th time it has been about AI just this year. Today I writing a little about how to invest in AI.
The best AI stocks for the long run will be those that use artificial intelligence to improve products or gain a strategic edge. Since the November 2022 release of GenerativeGPT by OpenAI and the near immediate $10 billion investment by Microsoft to acquire 49% of OpenAI, the buzz over generative AI has boosted the stock market, lead by tech giants such as cloud , chipmaker, enterprise software and cybersecurity companies. I see AI as a thematic investment opportunity and view the artificial intelligence categorically, made up of four categories. They are Infrastructure, Architecture, Drivers and Software.
An example of an AI infrastructure company is Nvidia. Generally, NVDA makes the chips that power AI. Palantir is an example of an AI architecture company. PLTR helps institutions store, analyze and act on data, allowing them to create and govern AI over vast public and private networks. Microsoft and Google are drivers of AI. I mentioned Microsoft’s investment in OpenAI which is re-invented Microsoft’s Bing search engine. Google is, well, GOOGLE. It IS search. Now, with Bard, Google has its own generative AI tool competing head-to-head with Bing. Finally, there’s the software category of AI stocks. Salesforce (CRM) and CrowdStrike (CRWD) are industry group leaders. Salesforce has used predictive AI tools since 2016. In March, CRM rolled out Einstein GPT, which adds OpenAI’s features across its software platform. For over a decade, CRWD has been at the forefront of AI innovation in cybersecurity. CRWD’s AI delivers the world’s most advanced cyber protection from modern threats, according to the company. Generative AI software spending is expected to boom from $1 billion in 2022 to $81 billion in 2027, representing a 190%, five-year compound annual growth rate, according to recent TD Cowen research.
If you’re looking for the best AI stocks, it’s a good time to be cautious amid the hype. Be on guard against poorly performing companies that are suddenly touting AI product innovations. The “old dogs -new tricks” idiom may not apply to selecting stocks to benefit from AI. Established (old) tech companies such as IBM, Intel, Microsoft, Cisco Systems, AMD and Adobe are already leading the way in harnessing the power of generative AI. Still under-30 year old (but close) companies like Amazon and Google are also dominant companies positioned to gain from the AI revolution.
How about beyond individual stocks for potential successful investments in AI? ETF’s may be a good alternative. Though still equity investments, ETF’s eliminate single stock risk. These investments are similar to mutual funds as they often own dozens of stocks and may own foreign stocks as well. So they provide diversification. However, they often are concentrated and focused on a specific investment objective. There are many AI ETF’s. AIQ, ARKQ and THNQ are good examples. AIQ holds 87 stocks, roughly 65% U.S. and 35% foreign. It’s top 5 holdings are Alibaba, Google, Meta, Tencent and Nvidia.
When recently asked by a friend what was the best way to invest in AI, I answered, “Ask AI.” As my kids used to say, “JK!” (just kidding!). I was kidding. But some believe that in the near future AI (the machine) will be smarter than us (“the man”). I, in part, believe that, too. If asked to do research on nuclear physics to write and edit a report, it would take me many hours. GPT AI can do that in seconds. Not so sure it is or ever will be better than you at knowing you. And know yourself is perhaps the most important thing to know when it comes to investing. So, when in investing in AI, or anything else, be true to you.
TAKING PERSPECTIVE…
Proper Perspective: In our hectic and often hard to comprehend world, it is very easy to lose perspective. You may agree it is sometimes difficult to see the big picture. The media often doesn’t help with this, but unfortunately instead encourages us to see things in a most negative light. Here is hopefully a pause to gain positive perspective.

Famous Quote For Today: “You only have to do a very few things right in your life so long as you don’t do too many things wrong.”
~~ Warren Buffet
What Happened On This Day, September 14, – Today is the day after Warren Buffett’s birthday. Mr. Buffett is 93 years young as of yesterday.
MARKET ANALYSIS
INDICATORS OF INTEREST:
- Market’s Current Signal: Uptrend Under Pressure. Analysis of the stock market over 130 years of history shows we can view it in terms of three stages – market in uptrend, uptrend under pressure and market correction. I analogize this to a traffic signal’s changing colors from green to yellow and then to red. Since the 1880’s, this perspective has led to investment out-performance relative to market indexes. This is due to trend analysis which determines risk reducing, return enhancing market entry and exit points. The U.S. stock market’s current signal is Uptrend Under Pressure.
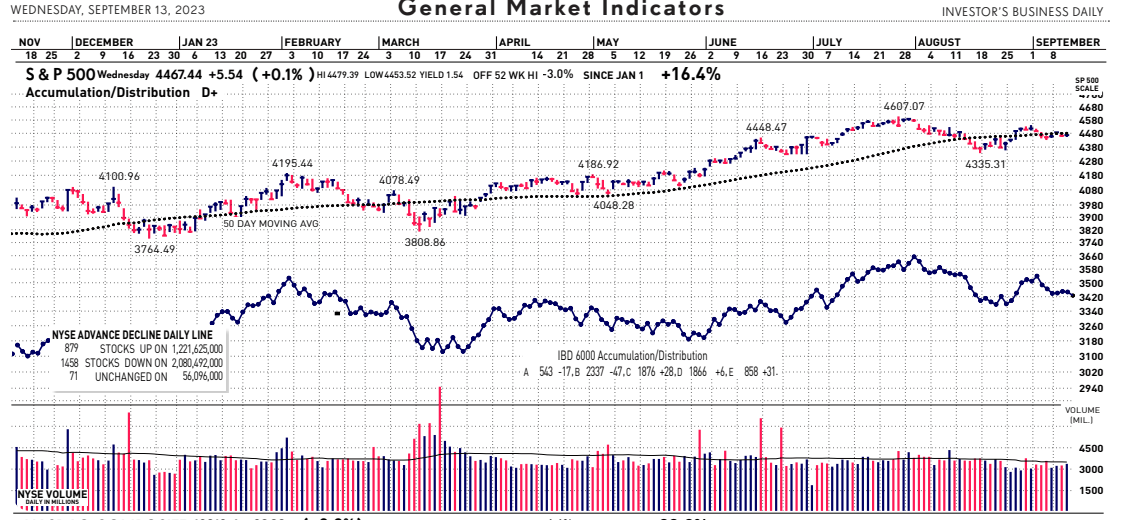
The Stock Market Trend: Uptrend Under Pressure. The U.S. stock market was trending in a Confirmed Uptrend from May 10 to August 2. A steep, broad and high volume bearish sell-off on that day caused a weaker stock market trend outlook to Uptrend Under Pressure. Continued persistent selling triggered a more bearish signal, knocking the market’s trend into Correction on August 17. A 3-week losing streak came to sudden stop as the resilient market showed strength again, resulting in another trend change back to Confirmed Uptrend Tuesday, August 29. That didn’t last long. On September 7 the stock market’s trend signal weakened to Uptrend Under Pressure.
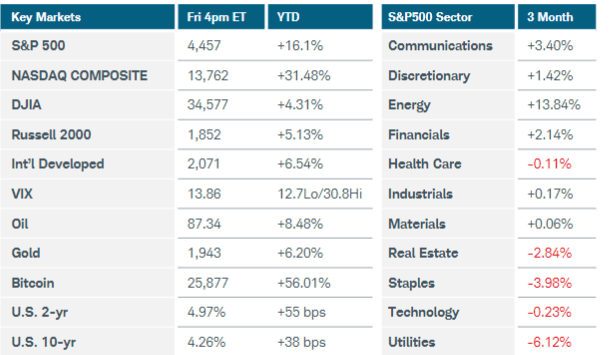
Here are key market levels as of Monday, September 11:

Recapping Last Week
Rising energy prices and better-than-expected economic data worried investors about the future path of interest rates, sending U.S. equity indexes lower for last week. The Russell 2000 Index slumped 3.6%, while the Nasdaq Composite dropped nearly 2% and S&P500 shed 1.3%. Nine of 11 S&P500 sectors lost ground, with basic materials and industrials sliding 2-3%. Apple tumbled 6%, weighing on the technology sector after reports that China banned iPhone use for government workers and Chinese firm Huawei released a new competitive smartphone. Crude oil futures rose again, now up 24% since the start of July, as Saudi Arabia and Russia extended their production cuts through year-end. Strikes at Australian natural gas facilities sent European prices sharply higher, prompting global supply squeeze fears. Falling energy prices had been the biggest contributor to easing global inflation this year, and a resurgence could keep interest rates higher for longer. U.S. Treasury yields and the dollar climbed even as comments from several FOMC policymakers indicated that further hikes this year may not be necessary. In other news, U.S. services activity expanded more than forecast in August, with increases in both new orders and prices paid. Unit labor costs were revised higher for Q2, but the Atlanta Fed Wage Growth Tracker fell from 5.7% to 5.3%, indicating falling but still stubbornly high nominal levels. The labor market remained tight, with weekly jobless claims falling to a seven-month low. The U.S. trade deficit continued to normalize after pandemic-related disruptions, and early estimates suggested that net exports will provide a modest boost to Q3 GDP growth.
Internationally, China reported another decline in imports and exports for August as demand for goods fades, while services activity expanded at the slowest pace in eight months. Central banks in Australia and Canada kept interest rates steady but vowed to remain vigilant on inflation. In Europe, Germany’s manufacturing struggles deepened in July, with factory orders and industrial production falling on sluggish output and high prices. Eurozone retail sales declined as consumers cut back on fuel purchases, while investor confidence sank to -21.5 in September.
Current View
Pick one word to describe the latest rally by the Nasdaq composite since the August 29 follow-through day. Lackadaisical? Good one. Simply a light market paints the picture of the market’s action in recent weeks. Overall, both bulls and bears can drum up multiple arguments to support their position. As usual, good news (on the economy) has been bad news (for the stock market). Yesteday’s CPI and today’s PPI are two more economic data points moving the financial markets and influencing the Fed. The probability for a quarter-point hike in the fed funds rate next week to a 5.5%-5.75% target range has droppedto 3%, according to CME FedWatch data. But those chances jumped to 41.6% for the following meeting on November 1. Market pundits and the media love to remind investors that September can be a cruel month for returns. Yet so far it’s been a pretty light decline with 11 trading days left in the month. Here’s some proper perspective on the stock market today: Rewind the clock back to August and September of 2022. The Federal Reserve was actively staging one of the sharpest series of rate hikes in nearly a century. The Nasdaq swooned 5.2% and nose-dived 10.6% during those two months. But today? Pretty quiet.
- Industry Group Strength: BULLISH. As of yesterday, 149 out the 197 groups I monitor are up year-to-date. 48 are down.
- New Highs vs. New Lows: BULLISH. In yesterday’s session, there were 94 new 52-week highs and 36 new 52-week lows.
- Dow Dividend Yield: BEARISH. The current yield for the Dow Jones Industrial Average is 2.22%. The 10-year Treasury now 4.28%.
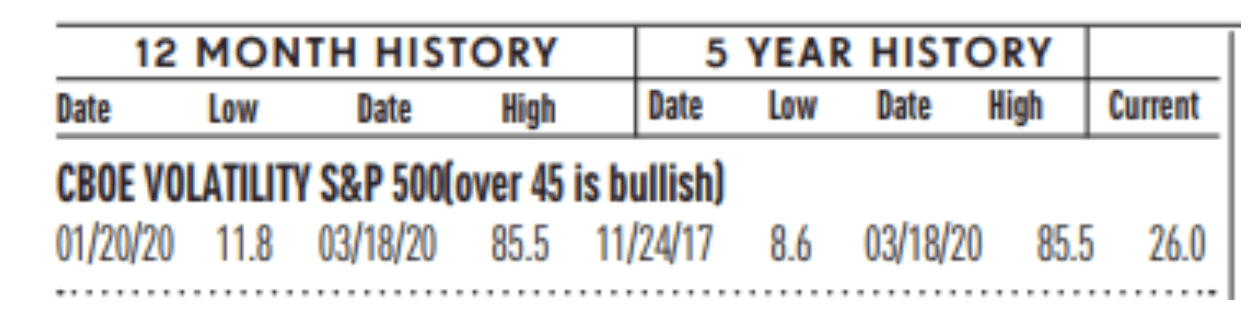
- Volatility Index: BEARISH. Volatility has been volatile. The “VIX” is now 13, same as two weeks ago. It is still at its lowest level since February 20, of 2020. The index is also known as the “Fear Index.” It is considered a contrarian indicator and therefore viewed as bullish as it rises indicating investors are becoming more fearful. The VIX:
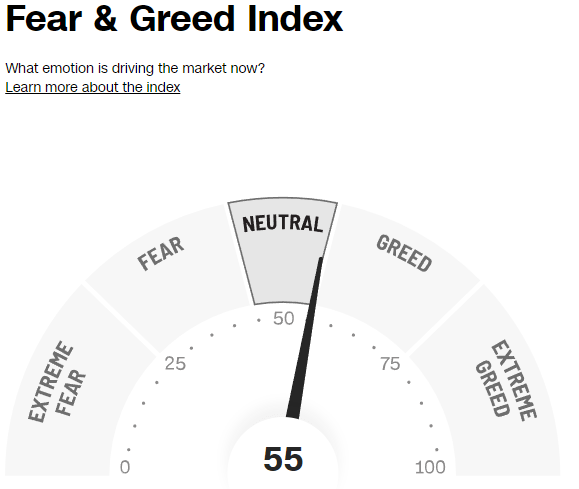
- Fear / Greed Index: Neutral. Investors are driven by two emotions: fear and greed. Too much fear can create a condition of oversold/ undervalued stock prices. Too much greed can result in overbought/overvalued stock prices. The AAII Investor Sentiment Index is now neutral. BE FEARFUL WHEN OTHERS ARE GREEDY. At 55, the Fear & Greed Index is up from 51 two weeks ago.
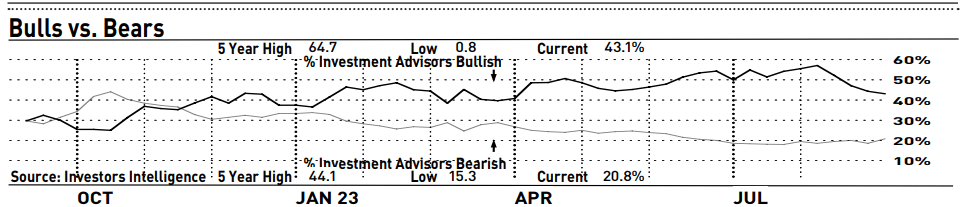
- Bull / Bear Barometer: NEUTRAL. This secondary market indicator should also be viewed with a contrarian perspective. As of yesterday, according to the latest survey of stock market newsletter writers by Investor’s Intelligence (see below), bullish sentiment is 50.7% and the bears came in at 22.5%. Both are up in the last two weeks. Consider this a contrarian indicator because the crowd is often wrong at market tops and bottoms. In other words, extreme bullishness has been seen near several market tops in the past, while extreme bearishness has been seen at market bottoms.
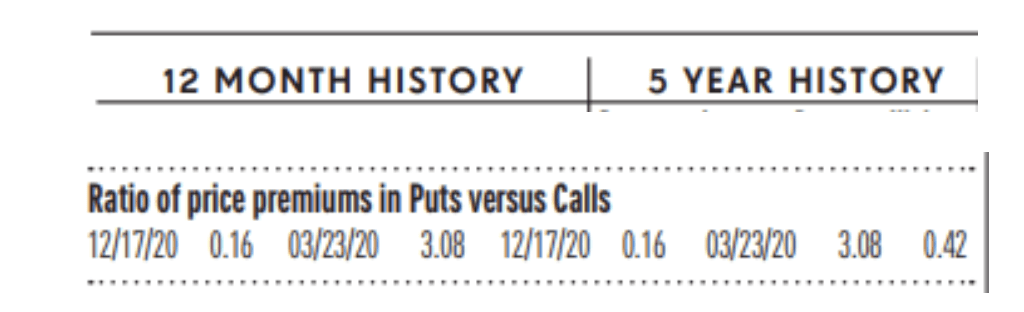
- Put / Call Ratio: BEARISH. The ratio of put-to-call options is 0.55, down from 0.32 two weeks ago. The put-call ratio tracks the mood of what options investors are doing, not just saying. They typically buy puts if they think a stock will decline and calls if they think it will rise. If they’re buying lots of puts, they see the market declining. And if they’re loading up on calls, they’re generally bullish. Historically, market bottoms occurred when the reading spikes to 1.2 or more. Market tops are often made when the reading is 0.6 or less. Note how reliable this is with respect to the February record low coinciding with the market high. Keep in mind this is also a contrarian indicator.
ECONOMIC UPDATES
Global Economic Indicators & Analysis:
POSITIVE INDICATORS
US Retail Sales Continue Winning Streak: Sales at U.S. retailers rose 0.6% in August despite a hangover for internet stores after the Amazon Prime Day event, but most of the increase was tied to higher gasoline prices. Retail sales represent about one-third of all consumer spending and usually offer clues on the strength of the economy. Forecasters predict the holiday shopping season could be the weakest in five years. A burst of momentum in the economy over the summer is likely to fade due to higher interest rates, but there’s little evidence to suggest a recession is on the way. Americans are still spending plenty of money. Unemployment is low and wages are finally rising faster than inflation, giving households enough buying power to keep the economy forging ahead.
Import/Exports Both Rise: The U.S. international trade deficit widened 2% in July to $65 billion, the Commerce Department said last Wednesday. The deficit is below its second-quarter average, meaning that trade could be a boost to growth in the July-September quarter. From a longer term perspective, the trade deficit is falling. Year-to-date, the trade gap is down 21.4% from the same period one year ago. Trade has been suffering from the was in Ukraine and the recent deterioration in the global outlook. Weak demand from Europe and China has been pushing exports down.
ISM Service Sector Highest Since February: An ISM barometer of U.S. business conditions at service companies such as restaurants and hotels strengthened to 54.5% in August from 52.7% in the prior month. This is the highest level since February. This is the eighth straight reading above the 50% threshold that indicates expansion in the economy. Despite mixed signals from regional Fed and national surveys, the service sector has remained resilient. We expect this trend to continue, however any signs of weakening would be noteworthy since services and consumer spending have been the major drivers of growth lately.
Wholesale Inventories Slip, Sales Jump: Biggest rise in sales in more than a year pushes down inventories-to-sales ratio to lowest level since February. Economists are watching the inventory-to-sales ratio closely. Higher inventories could push companies to lower their prices, which would cool inflation. At the same time, unwanted backlogs might also signal a slowdown in the economy.
Consumer Credit Slows: Total consumer credit rose $10.4 billion in July, down from a revised $14 billion gain in the prior month, the Federal Reserve said last Friday. That translates into a 2.5% annual rate, slower than the revised 3.4% gain in the prior month. Consumer spending has picked up in the third quarter, according to government data. There are signs of stress for low-income workers but overall credit conditions remain in relatively good shape after the pandemic. Some Fed officials think that the excess savings built up during the stay-at-home period are now running out.
WEAK INDICATORS
CPI’s Biggest Increase in 14 Months: Yesterday brought the much anticipated CPI report. U.S. consumer prices leaped 0.6% in August — the biggest increase in 14 months — largely because of higher oil prices. Yet inflation more broadly did not appear to show worrying signs. The yearly rate of inflation moved up to 3.7% last month from 3.2% in July and a 27-month low of 3% in June. The August inflation report is unlikely to sway senior Fed officials ahead of their regular meeting next week at which they expected to hold a key U.S. interest rate at current levels. Some economists even think the Fed is done raising rates. Inflation is still more than double the Fed’s 2% target based on its preferred core measure, but it’s been headed in the right direction. That’s probably enough to keep the Fed on the sidelines at its policy meeting next week. And the bank might be done raising interest rates if shelter and labor costs continue to moderate. Any backsliding in those areas, however, could also force the Fed’s hand.
PPI Spikes Again: Fueled by higher energy costs, U.S. wholesale prices jumped 0.7% in August to mark the largest increase in 14 months and signal that inflation is likely to persist for a while. Wholesale costs often foretell future inflation trends. The increase in wholesale prices over the past 12 months climbed to 1.6% from 0.8% in the prior month. The PPI report captures what companies pay for supplies such as fuel, packaging and so forth. These costs are often passed on to customers at the retail level and give an idea of whether inflation is rising or falling. After almost turning negative early in the summer, wholesale prices have crept higher in the past few months. But they are no longer signaling rapid price increases. Senior Fed officials believe inflation will continue to decelerate in fits and starts and that the U.S. might even evade a long-predicted recession. But the latest CPI and PPI reports show the battle is far from over.
US Budget Deficit Disaster: The U.S. federal budget deficit will double from $1 trillion last year to $2 trillion this year, when President Biden’s unsuccessful plan to forgive student loans is excluded, according to a new estimate from the Congressional Budget Office on Monday. According to the CBO’s estimate, so far this fiscal year, revenues are 10% lower and outlays are 3% higher than the prior year. Wall Street is growing concerned about the ballooning deficit and federal debt.
Fed’s Beige Book Shows Weakness: The Fed’s survey, conducted this time by the Kansas City Fed, is released eight times a year, always before Fed interest-rate meetings. It is designed to give policymakers a sense of conditions “on the ground” across the country. The U.S. economy grew at a modest pace in July and August, bolstered by “the last stage of pent-up demand” for leisure activities according to the Federal Reserve’s latest survey of economic conditions that is known as the “Beige Book.” Job growth was subdued across the country. Wage growth remained elevated but contacts in nearly all districts expect these gains to moderate in coming months. Prices in consumer goods sectors fell faster than in many other sectors, Yet businesses are still facing high costs for inputs, putting pressure on profit margins. The Beige Book suggest that this acceleration may falter in the autumn.
Jobs Report Up: September kicked off Friday the 1st with the August jobs report. The U.S. created 187,000 new jobs in August, but new hires totaled less than 200,00 for the third month in a row and added to mounting evidence of a cooling labor market. The unemployment rate, meanwhile, jumped to 3.8% from 3.5%, the government said Friday, marking the highest level in a year and a half. The share of people working or looking for work, meanwhile, climbed to 62.8% and hit the highest level since early 2020. The labor market has cooled off, but an acute worker shortage is still keeping wage growth elevated and adding to upward pressure on inflation.
ISM Manufacturing Index Falls Again: ISM factory index stumbles for 10th consecutive month in August. Manufacturing has been hurt by the Federal Reserve’s rapid push to raise interest rates and the weakening global economy. In an environment where the rest of the global economy still appears to be weakening and domestic demand growth looks set to slow, we doubt that a sustained recovery in manufacturing activity is on the cards.
US Factory Orders Plunge: Orders for U.S. manufactured goods fell a sharp 2.1% in July, the Commerce Department said last Tuesday. This is the first decline after four straight monthly gains. Economists said that higher interest rates are putting pressure on business equipment spending.
Call me if you have any questions. I am always happy to help!
John J. Gardner, CFP®, CPM®.
Blackhawk Wealth Advisors, Inc.
3860 Blackhawk Rd. Ste. 160 Danville, CA. 94506
Phone: 888-985-PLAN · Email: jg@blackhawkwealthadvisors.com
BLACKHAWKWEALTHADVISORS.COM
For my Market Monthly podcast, click on the link below. I provide a review of global stock market highlights over the past month and preview of the month ahead. Forward insights and perspectives are based on current financial market and economic trends with an emphasis on relevant developments in various areas from Fed policy to company earnings announcements.
Link to my Market Monthly Podcast