


ERPE EXCERPTS
Bi-MONTHLY MARKET ANALYSIS &
ECONOMIC UPDATES
May 4, 2023
No Cause for Pause…
10th Fed Rate Hike
No pause, at least not yet. The FOMC, the Federal Reserve’s interest rate hike machine, raised rates again yesterday by another quarter point. This was the 10th consecutive interest rate hike since March of last year (including the 3rd time this year). The Fed’s aggressive pace of rate increases is the fastest in forty years. The furious flight higher in rates has taken rates from near zero just over a year ago to 5% now. It’s fight with inflation has the market worried a victory in taming inflation will come at the cost of knocking the economy into a harsh recession.
While yesterday’s rate hike was highly expected, some market participants thought the Fed should pause, especially due to recent regional bank weakness. The Fed inferred it had no cause to pause, though it rephrased its message in its post-meeting statement, scrapping a line saying that “some” additional hikes “may” be needed. The Fed, however, did signal it was ready to pause and said further monetary tightening would depend on how inflation and the economy respond to sharply higher borrowing costs. However, the Fed’s softer language still left open the possibility it could raise rates again if inflation remained high.
The last?
Chairman Powell said they are “closer to the end” of this tightening cycle than the beginning. Yesterday’s rate hike could very well be the last of the current cycle. Powell himself suggested interest rates could be restrictive enough to do the job in getting inflation back down to pre-pandemic levels. The Fed is aiming to reduce inflation, now running at 4.2% rate based on its preferred PCE index, to its 2% target within the next few years. So, though there is still a long way to go, most Fed officials are are opposed to additional rate tightening. The other side of the rate coin is to cut, or lower, interest rates. While Powell said yesterday, “It would not be appropriate to cut rates,” many investors think the economy will slow so much that the Fed will cut rates by the end of the year.
Yesterday’s stock market reacted in an up-then-down way to the the Fed’s action and words. After rising in the minutes following the rate increase announcement, the market closed weakly after hearing Chairman Powell’s comments. The good news is, compared to how the market reacted to recent Fed rate increases, the market’s move yesterday was mild. Back on September 21, the stock market fell sharply by 1.7%. The next day it fell another 0.8%, and then dropped the next three sessions. Then the market sold off on the November and December rate hikes. On November 2, the Fed hiked rates by 75 basis points again. On December 14, they tapered the increase to half a point, or 50 basis points. The stock market fell a combined 3.5% over November 2 and 3, and slid 5.1% over a four-session decline from December 14 to 19.
That kind of stock market volatility is the reason for the the Wall St. adage, “Don’t fight the Fed.”
TAKING PERSPECTIVE…
Proper Perspective: In our hectic and often hard to comprehend world, it is very easy to lose perspective. You may agree it is sometimes difficult to see the big picture. The media often doesn’t help with this, but unfortunately instead encourages us to see things in a most negative light. Here is hopefully a pause to gain positive perspective.

Famous Quote On This Day: “Beware the power of the pajama-clad, Cheeto-eating, twitter, blogging hordes. We are legion!”
~ ~ Rachel Maddow, 2009
What Happened On This Day, May 4, – 1924 – 8th Summer Olympics opens in Paris.
MARKET ANALYSIS
INDICATORS OF INTEREST:
- Market’s Current Signal: Market in Uptrend Under Pressure. Analysis of the stock market over 130 years of history shows we can view it in terms of three stages – market in uptrend, uptrend under pressure and market correction. I analogize this to a traffic signal’s changing colors from green to yellow and then to red. Since the 1880’s, this perspective has led to investment out-performance relative to market indexes. This is due to trend analysis which determines risk reducing, return enhancing market entry and exit points. The U.S. stock market’s current signal is Uptrend Under Pressure.
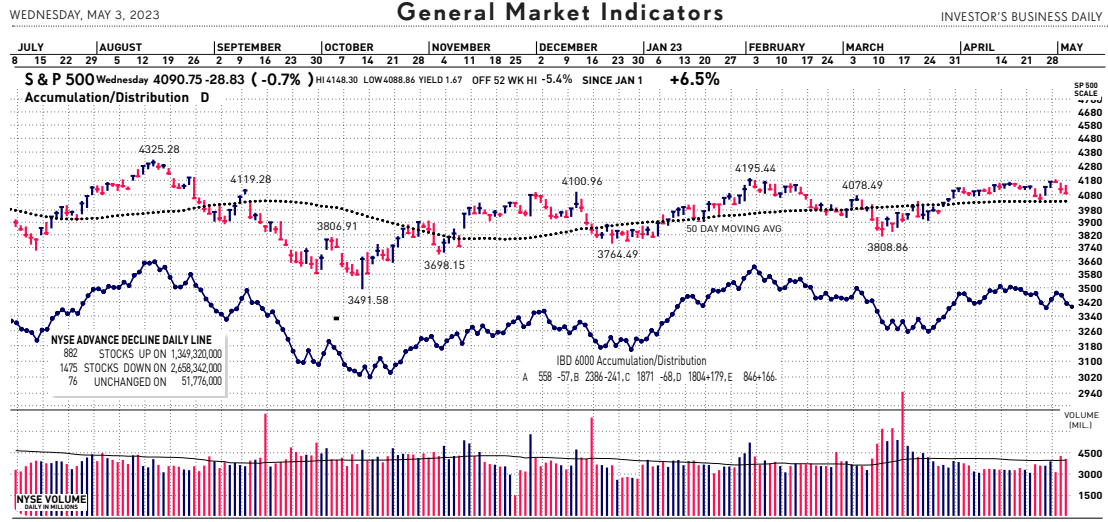
The Stock Market Trend: Uptrend Under Pressure. After the regional banking crisis in mid-March, the general market weakened to Market in Correction March 15. In a resilient rally, the trend turned bullish with a signal change to Market in Confirmed Uptrend on March 29. That trend signal flashed caution and indicated weakness on April 25 as the market’s trend changed to Uptrend Under Pressure.
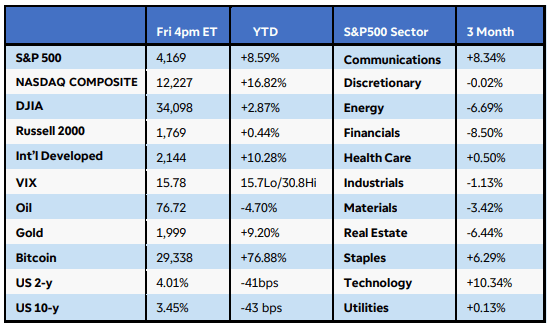
Here are key market levels as of Monday, May 1:
Recapping Last Week
U.S. equities recovered from an early week decline after stronger-than-expected large-cap technology company earnings and an uneventful inflation report. The S&P500 Index rose 0.9%, while the Nasdaq Composite gained 1.3%. The Russell 2000 fell 1.25% after a dismal earnings report from First Republic Bank renewed systemic concerns in the financial sector. Six of 11 S&P500 sectors managed gains, led by communications and technology. Crude oil dropped another 1.5% despite a Friday rally as global growth fears weighed. U.S. Treasury yields rose at the short end but fell at the long end after March’s Core PCE Price Index reflected price increases that continue to slow but at a snail’s pace. The services sector continued to be the driving force for inflation, and the Q1 Employment Cost Index came in slightly above expectations at 1.2%. Annual U.S. wage growth was 5.1%, still well above the Fed’s comfort level of 3.5% that would be consistent with their intended 2% inflation target. Although the first reading of Q1 GDP was lower than forecasts at 1.1%, the slowdown was mostly attributed to weak inventory investment. Consumer spending was much stronger than the prior quarter at 3.7%, and overall, the data and fed funds futures point towards at least one more rate hike.
Internationally, the Eurozone narrowly avoided contraction in Q1, with GDP expanding by just 0.1%, while Germany’s April inflation figures ticked lower but remained well elevated at +7.2% year-over-year. The Bank of Japan left policy unchanged but pledged a “broad-perspective review” of easing measures. Tokyo’s CPI rose 3.5% y-o-y in April, and core prices remained lofty at 2.3% y-o-y.
Current View
The stock market mostly frowned over yesterday’s decision by the Federal Reserve to push up short-term interest rates by another quarter point for the third time this year – and the 10th time in 13 months. Volume rose in yesterday’s trade as the major indexes closed at their session lows. This handed the composite index a fifth day of distribution, a clear-cut sign of professional selling. A distribution day is a down day when the market is down 1% or more on higher volume than the previous day.
The Fed stressed that the banking system is “sound and resilient” during yesterday’s long news conference. That is obviously incorrect as more regional bank turmoil surfaced only hours after Powell’s speech. PacWest Bancorp plummeted about 55% yesterday after the market close on a report the bank was looking for a buyer to sell itself to. Its profits have fallen five quarters in a row (down 20%, 33%, 13%, 71% and 35%). Many question the Fed’s rate hikes in the midst of a melt down in small, regional banks. The regional bank stock index has fallen nearly 16% in the last four sessions and 38% so far this year, reigniting bank contagion fears. There’s little that Jerome Powell can do right now to stop this runaway train.
Besides the Fed, regional banks, and the politics over the government’s debt ceiling, earnings are dominating daily news impacting stock prices. Q1 earnings have produced new themes that could persist through 2023. These include corporate pricing power, particularly for consumer staples names, efficiency and cost-savings initiatives, easing supply chain pressures, elevated but moderating input price pressures, better guidance/revision trends, housing market rebound, industrial strength, weakness in areas such as freight and consumer electronics, macro headwinds on enterprise spending, and mixed China recovery read-throughs.
Volatility is increasing and investor sentiment is decreasing. There is an inordinate amount of uncertainty now. There are more bricks in the wall of worry making a higher hurdle for the market to climb. Remember, it always does.
- Industry Group Strength: BEARISH. As of yesterday, 86 out the 197 groups I monitor are up year-to-date. 111 are down.
- New Highs vs. New Lows: BEARISH. In yesterday’s session, there were 146 new 52-week highs and 281 new 52-week lows.
- Dow Dividend Yield: BEARISH. The current yield for the Dow Jones Industrial Average is 2.20%. The 10-year Treasury now 3.32%.
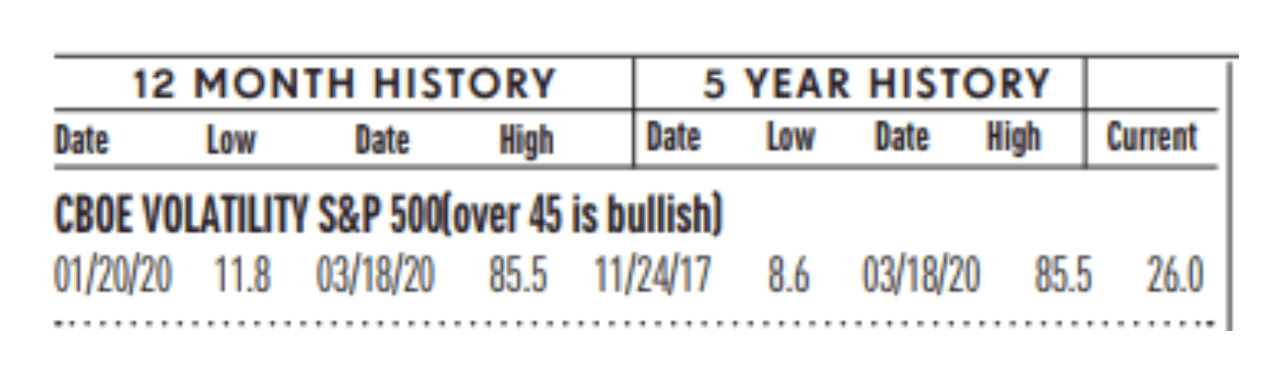
- Volatility Index: NEUTRAL. Volatility has been volatile. The “VIX” is now 21, down from 16.5 two weeks ago. The index is also known as the “Fear Index.” It is considered a contrarian indicator and therefore viewed as bullish as it rises indicating investors are becoming more fearful. The VIX:
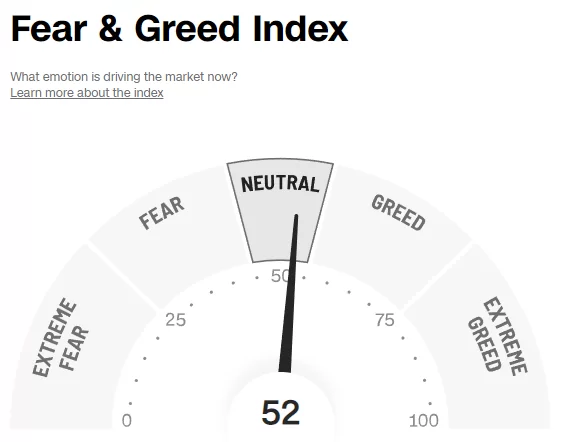
- Fear / Greed Index: NEUTRAL. Investors are driven by two emotions: fear and greed. Too much fear can create a condition of oversold/ undervalued stock prices. Too much greed can result in overbought/overvalued stock prices. The AAII Investor Sentiment Index is now neutral. BE FEARFUL WHEN OTHERS ARE GREEDY. At 52, the Fear & Greed Index is up from 68 two weeks ago.
- Bull / Bear Barometer: BEARISH. This secondary market indicator should also be viewed with a contrarian perspective. As of yesterday, according to the latest survey of stock market newsletter writers by Investor’s Intelligence, bullish sentiment is 45.8% and the bears came in at 23.6%. Consider this a contrarian indicator because the crowd is often wrong at market tops and bottoms. In other words, extreme bullishness has been seen near several market tops in the past, while extreme bearishness has been seen at market bottoms.
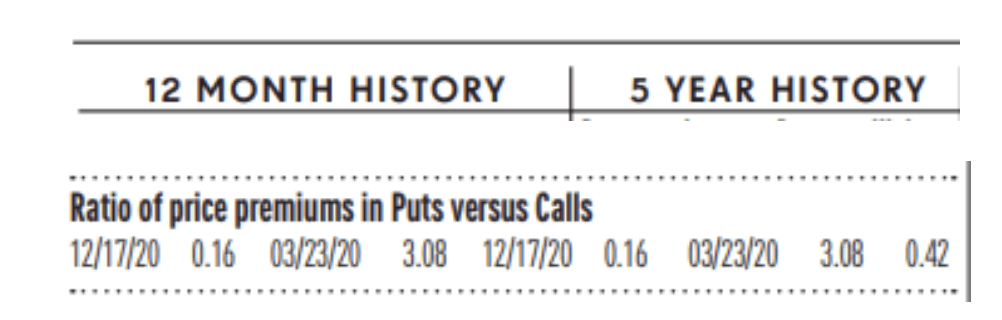
- Put / Call Ratio: NEUTRAL. The ratio of put-to-call options is 1.00, up from .70 two weeks ago. The put-call ratio tracks the mood of what options investors are doing, not just saying. They typically buy puts if they think a stock will decline and calls if they think it will rise. If they’re buying lots of puts, they see the market declining. And if they’re loading up on calls, they’re generally bullish. Historically, market bottoms occurred when the reading spikes to 1.2 or more. Market tops are often made when the reading is 0.6 or less. Note how reliable this is with respect to the February record low coinciding with the market high. Keep in mind this is also a contrarian indicator.
ECONOMIC UPDATES
Global Economic Indicators & Analysis:
POSITIVE INDICATORS
U.S. New Home Sales Up: U.S. new home sales rose 9.6% to an annual rate of 683,000 in March, from a revised 623,000 in the prior month, the Commerce Department reported Tuesday. That’s at the highest level since last year. The number is seasonally adjusted, and refers to how many homes would be built over an entire year if builders continue at the same pace every month. The jump was better than what economists on Wall Street expected. They had forecast new home sales to fall to 634,000 in March. A lack of inventory has pushed U.S. home buyers to purchase new homes, prompting a surge in sales in March. The data from February was revised significantly. New home sales fell to a revised 623,000 in February, compared with the initial estimate of a 1.1% increase to 640,000.The median sales price of a new home sold in March was $449,800. The supply of new homes for sale fell 9.5% between February and March, equating to a 9-month supply.
Construction Spending Up: Outlays for construction projects rose 0.3% in March at a seasonally adjusted annual rate of $1.83 trillion, the Commerce Department reported Monday. Economists polled by The Wall Street Journal had expected a flat reading. Over the past year, construction spending has been an engine of growth for the economy, rising 3.8%. Spending in February was revised up to a 0.3% fall from the prior estimate of a 0.1% decline. Residential construction fell 0.2% in March, the 10th straight monthly decline. Non-residential construction was up 0.7% last month. This is the ninth gain in the past 10 months. Public construction was up 0.2 after a 1.1% in February.
Durable Goods Orders Up: Orders for manufactured goods got a boost in March from new contracts for passenger planes, but more broadly, business investment fell again in another sign the U.S. economy is slowing. Durable-goods orders jumped 3.2% last month, the government said Wednesday. Economists polled by the Wall Street Journal had forecast a 0.5% increase. However, orders rose a scant 0.3% if cars and planes are excluded. The transportation segment is a large and volatile category that often exaggerates the ups and downs in industrial production. Orders rise in an expanding economy and shrink in a contracting one. The pace of orders has slowed sharply over the past year and is now just slightly positive. The yearly rate of growth slowed to 2% in March, the lowest reading in more than three years. These so-called core orders were rising at an 11% pace just one year earlier. The industrial side of the economy appears to have fallen into a slump after several years of rapid growth, and some see it as a prelude to a broader U.S. recession.
Manufacturing Orders Up: Orders for U.S. manufactured goods rose 0.9% in March, the Commerce Department said Tuesday. The increase follows two straight declines. Economists surveyed by the Wall Street Journal were expecting a 1.2% rise. The increase was powered by strong orders for transportation, especially commercial aircraft. Excluding transportation, orders were down 0.7% for the second straight month in March.
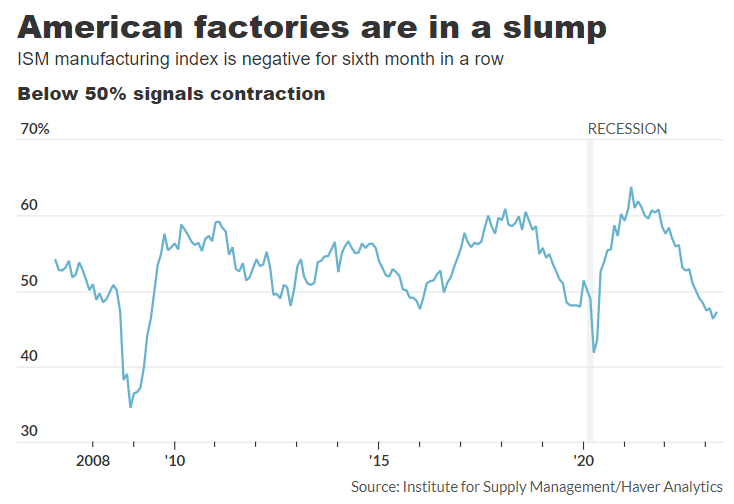
ISM Manufacturing Index Up: The Institute for Supply Management’s manufacturing survey released Monday rose to 47.1% from a three-year low of 46.3% in the prior month. Economists polled by the Wall Street Journal had forecast the index to register 46.7% in April. U.S. factories hung in negative territory for the sixth month in a row. Numbers below 50% signal contraction in the industrial side of the economy. The last time the index was below that threshold for more than six months was between March 2008 and June 2009 — during the Great Recession.
ISM Services Index Up: Yesterday, the Institute for Supply Management’s index of service-oriented businesses moved up from 51.2% in March. Numbers above 50% indicate companies are expanding. Economists polled by The Wall Street Journal had expected the services index to rise to 51.8%.
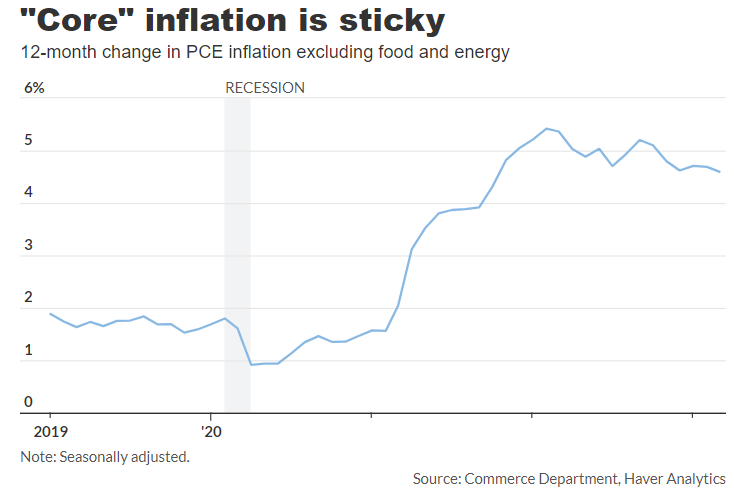
PCE Shows Inflation Slows: The cost of goods and services rose a scant 0.1% in March and the yearly rate of inflation slowed again in response to higher interest rates and a cooler economy. But inflation is still sticky by another key measure. The increase in the personal-consumption-expenditures index matched the Wall Street forecast. The PCE index is the Federal Reserve’s preferred inflation barometer. The yearly increase in prices declined to 4.2% from 5.1% in the prior month, the government said Friday. That’s the lowest level since May 2021, although it’s still double the Fed’s 2% target for inflation. Also, the closely followed core PCE inflation index increased a sharper 0.3% last month.
WEAK INDICATORS
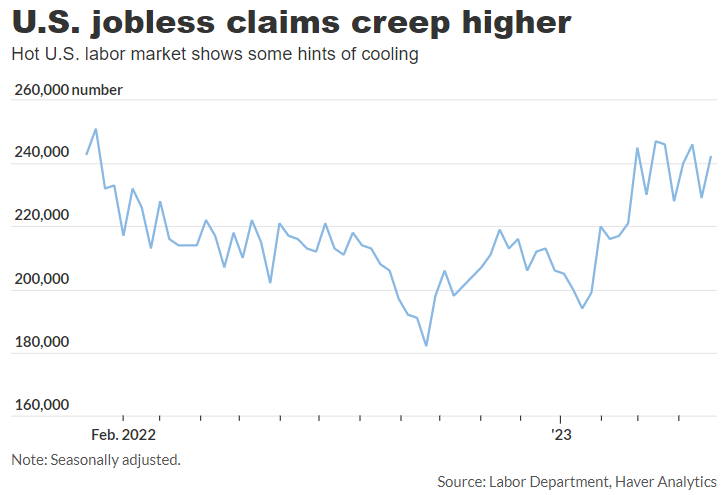
Jobless Claims Up: The number of Americans who applied for unemployment benefits at the end of April rose by 13,000 to 242,000 and hinted at some softening in a muscular U.S. labor market. New jobless claims increased from a revised 229,000 in the prior week, the Labor Department said today. The figures are seasonally adjusted.New jobless claims have risen from fewer than 200,000 in January in a sign the labor market is cooling. The number of filings is at the highest level since late 2021.
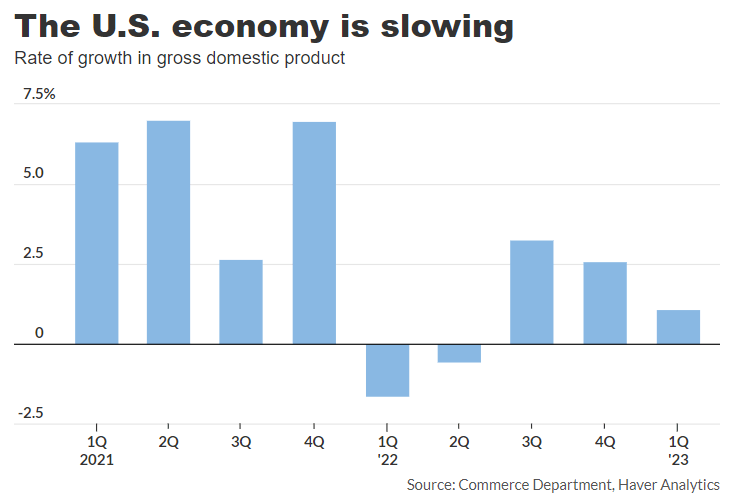
GDP Down: The U.S. economy grew at a soft 1.1% annual pace in the first three months of this year, as declining business investment offset strong consumer spending and pointed to slowing growth, according to last Thursday’s government report. Wall Street analysts had forecast a 2% increase in gross domestic product, the official scorecard for the economy. GDP had expanded 2.6% in the fourth quarter. Consumer spending, the main engine of U.S. growth, drove the economy forward in the first quarter. Outlays jumped at a 3.7% clip, the biggest increase in almost two years. Inflation rose at an annual 4.2% pace in the first quarter, compared to a 3.7% increase in the 2022 fourth quarter.
Productivity Down: U.S. productivity fell at a 2.7% annual clip in the first quarter, the government said today. Economists surveyed by the Wall Street Journal had projected a 1.9% decrease. Over the past four quarters, U.S. productivity has fallen at a 0.9% pace. Output in the first quarter rose 0.2%. Hours worked rose 3%. U.S. real gross domestic product expanded at a 1.1% annual rate, down sharply from 2.6% growth in the fourth quarter. Unit-labor costs, a key measure of wages, picked up to a 4.5% rate in the first quarter, up from a 3.3% rate in the prior three months. Over the past 12 months, unit labor costs are up 5.3%.
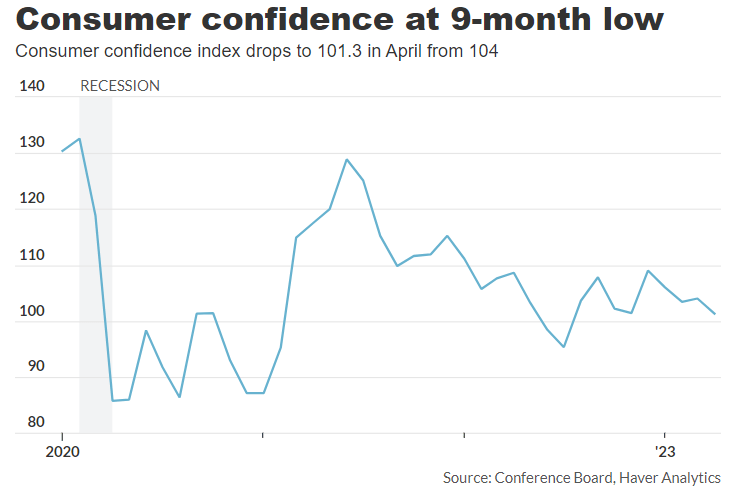
Consumer Confidence Down: A survey of consumer confidence fell in April to a nine-month low of 101.3, reflecting nagging worries about a possible U.S. recession and a softening labor market. The closely followed index dropped 2.7 points from a revised 104 in the prior month, the Conference Board said last Tuesday. The level of confidence in April was the lowest since July 2022. Economists polled by The Wall Street Journal had forecast the index to register 104. Consumer confidence tends to signal whether the economy is getting better or worse. The index remains well below the levels associated with a healthy economy.
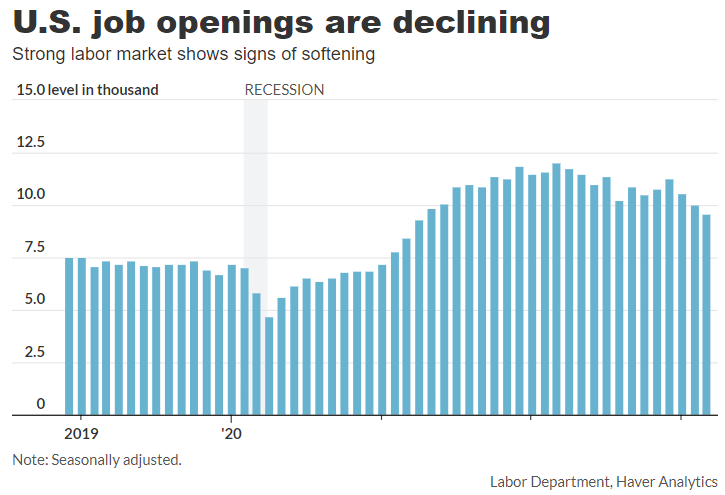
Jobs Listings Down: Job listings declined from a revised 10 million in February, the Labor Department said Tuesday. Job openings fell to a nearly two-year low of 9.6 million in March in a sign the U.S. labor market is gradually cooling off, but competition for workers remains intense and is adding to upward pressure on wages and inflation. Job postings have tapered off from a record high last spring in response to a cooler economy and talk of recession. The number of people quitting jobs, meanwhile, fell slightly to 3.9 million. Quits have tallied fewer than 4 million for three months in a row for the first time since 2021.
An easy way to get my ERPE Excerpts is by “text-to-subscribe”. By simply texting to the number 22828 and entering the word erpe excerpts, a prompt is sent to enter an email address and done! You will then receive my bi-monthly market and economic updates. Please pass this on.
Call me if you have any questions. I am always happy to help!
John J. Gardner, CFP®, CPM®.
Blackhawk Wealth Advisors, Inc.
4125 Blackhawk Plaza Circle, Ste. 260 Danville, CA. 94506
Phone: 888-985-PLAN ·
Email: jg@blackhawkwealthadvisors.com
BLACKHAWKWEALTHADVISORS.COM
For my Market Monthly podcast, click on the link below. I provide a review of global stock market highlights over the past month and preview of the month ahead. Forward insights and perspectives are based on current financial market and economic trends with an emphasis on relevant developments in various areas from Fed policy to company earnings announcements.