


ERPE EXCERPTS
Bi-MONTHLY MARKET ANALYSIS &
ECONOMIC UPDATES
May 18, 2023
Debt Default Debate
Partisan Talks to Get a Debt Deal Done
Yogi Berra said, “It’s like déjà vu all over again.” Today’s temperature-rising debates over our country’s debt ceiling would likely spur Yogi to repeat that quote. “Here we go again” is the first thought I had in mid-January when the U.S. Treasury Department said it was bumping up against its debt “ceiling”, limiting its ability to borrow more to pay its bills. It would literally take an act of Congress to increase the Government’s debt limit. I had an immediate flash-back to 2011, the last time our country faced the fear of debt default by the government. While the notion of the U.S. government running short of money to pay its bills is absurd, failure to raise the borrowing limit could cause debt defaults soon; just as the threat in 2011. As I wrote in my July 28, 2011 ERPE Excerpts, “expect a “deal” to be made” to avoid default. You can read here what I wrote days before the 2011 debt ceiling deadline, Debt Deadline: Default, Downgrade or Deal?
Back in 2011 the Treasury Department needed Congress to raise its debt ceiling above $14.3 trillion, allowing the government to borrow more money so it could pay its bills. Today, the government is nearly $34.1 trillion in debt, and again the nation’s it at its borrowing limit. Perhaps your first impression is that amount of debt increase by our country is outrageous. I think so. To put it in perspective, I ran a calculation to see what the same $14 trillion in 2011 if invested in the SP500 would have grown to by the end of last year. It would have increased to $63 trillion, with all dividends reinvested. Maybe if the government managed its money accordingly it would have a better balance sheet…just saying.
I noted in writing about the 2011 near-debt-debacle that the situation and consequences of default were “very grave”. No different now. A first-ever U.S. default would plunge the country into recession and inject chaos into the global financial markets. The largely political standoff has started to worry investors. I have had conversations with clients who are simply fearful. Like a game of chicken, the debt ceiling situation may not end well, BUT the possibility of a government debt default should be off the table. Non-negotiable. Zero tolerance for a default outcome. Like 2011’s borrowing limit concerns, today’s debt ceiling worries and other macroeconomic issues add to investor FUD (fear, uncertainty and doubt). It is difficult to invest or alter asset allocation around political or geopolitical risk due to the inherent unpredictability. We do, though, have the benefit of lessons learned from similar past experiences. So, let’s keep the 2011 debt ceiling/debt default scare and market reaction in mind.
In 2011, the debates, controversy, politics and market fears started slowly in January and gained momentum and increased market concerns up to July 31, when the debt ceiling was raised, just 2 days before the Treasury expected to exhaust its borrowing power. The stock market peaked in late March and fell hard, bottoming the week on Nov 7, 2011 – about 22% lower. As is the market’s nature, it changes direction quickly and unpredictably. Let’s look at the market moves and see the decline and quick snap-back recovery. I have attached two SP500 images. The first is the fall and the second is the snap back, exceeding the high before the fall.
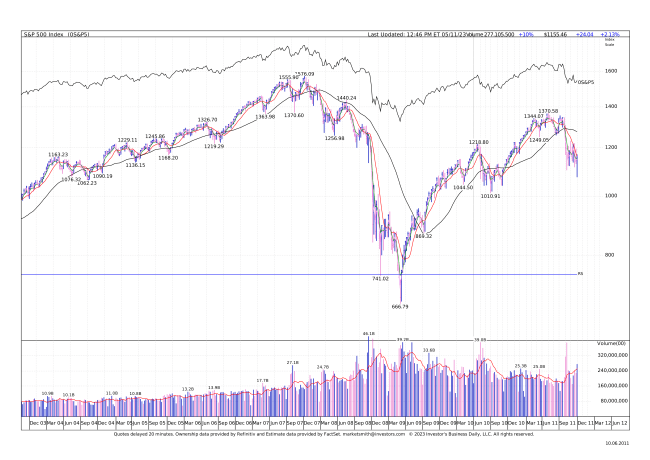
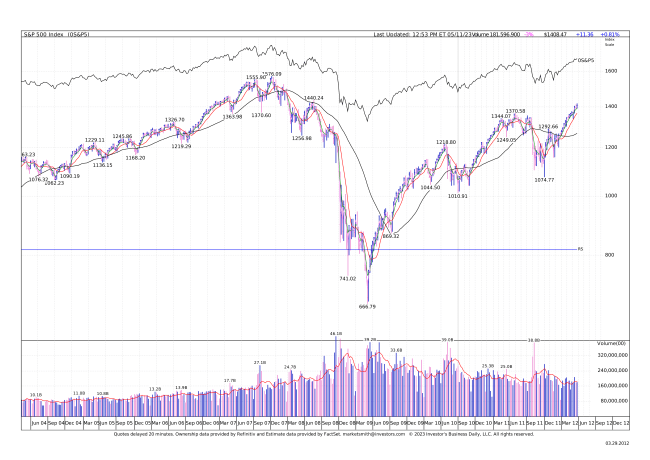
In the first image you can see the March peak and fall until the week of November 7 (these are weekly charts to the SP500). Again, that decline was 22% from the 1370 peak to 1017 in early November. Now, look at the second chart, which continues where the first ends and goes to the end of March 2012. First, notice by the end of the week the index hit its low in early November, it closed up 10% for that same week. It kept climbing sharply to the end of March, reversing the entire decline and closed March at 1400 – – all declines recovered and then some. Today the SP500 is about 2.5x that. The lesson? For an investor owning shares in good companies, staying invested during the steep, short-term selloff and benefiting from higher prices soon after was doing the right thing. Similar market action, but even more extreme, occurred with the “Covid crash” and the ensuing rapid rise between March and April of 2020. Naturally, the urge to sell stocks to avoid losses hits us during times we think the market will fall. I learned early in my career that it is often better to stay in the market that might go down than to get out of the one that doesn’t.
TAKING PERSPECTIVE…
Proper Perspective: In our hectic and often hard to comprehend world, it is very easy to lose perspective. You may agree it is sometimes difficult to see the big picture. The media often doesn’t help with this, but unfortunately instead encourages us to see things in a most negative light. Here is hopefully a pause to gain positive perspective.

Famous Quote On This Day: “To give victory to the right, not bloody bullets, but peaceful ballots only, are necessary.”
~ ~ Abraham Lincoln, 1858
What Happened On This Day, May 18, – 1852 – Massachusetts makes it mandatory that all school-age children must attend school.
MARKET ANALYSIS
INDICATORS OF INTEREST:
- Market’s Current Signal: Confirmed Uptrend. Analysis of the stock market over 130 years of history shows we can view it in terms of three stages – market in uptrend, uptrend under pressure and market correction. I analogize this to a traffic signal’s changing colors from green to yellow and then to red. Since the 1880’s, this perspective has led to investment out-performance relative to market indexes. This is due to trend analysis which determines risk reducing, return enhancing market entry and exit points. The U.S. stock market’s current signal is Confirmed Uptrend.
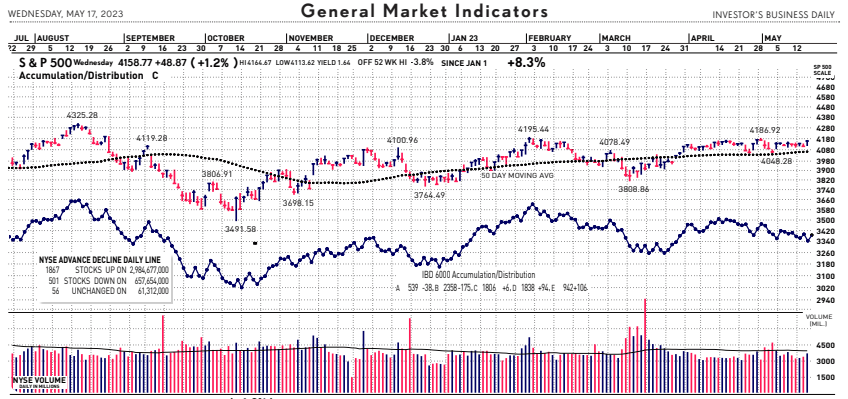
The Stock Market Trend: Confirmed Uptrend. After the regional banking crisis in mid-March, the general market weakened to Market in Correction March 15. In a resilient rally, the trend turned bullish with a signal change to Market in Confirmed Uptrend on March 29. That trend signal flashed caution and indicated weakness on April 25 as the market’s trend changed to Uptrend Under Pressure. Then, on May 10 the market’s trend changed again, to Confirmed Uptrend.
Here are key market levels as of Monday, May 15:
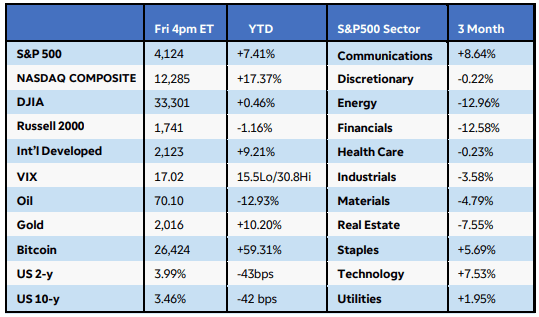
Recapping Last Week
U.S. equity indexes once again traded within a narrow range to end the week with mixed performance after a tame consumer inflation report. The Nasdaq Composite Index rose 0.4%, while the S&P500 fell 0.3%. Sector breadth was largely negative, and while defensive sectors have outperformed quarter-to-date, the increasing likelihood of a soft landing lifted consumer discretionary and communication services. U.S. Treasury yields tumbled after April’s CPI showed headline prices rose at the slowest annual rate since April 2021. Core inflation remained sticky at +5.5% year-over-year due to high rent costs, but analysts remained optimistic that recent evidence of falling shelter expenses should work its way into the data in the coming months. U.S. producer prices rose less than expected in April despite an uptick in the services index. The effects of the FOMC’s rapid rate hiking campaign were evident in other U.S. data. Weekly jobless claims jumped to 264K, the highest reading since October 2021, while consumer sentiment in May plunged to six-month lows as debt ceiling concerns added another headwind. The New York Fed’s consumer expectations survey for April revealed that household spending is anticipated to decrease significantly over the next year along with a corresponding decline in the inflation outlook. Small business confidence fell to a 10-year low in April.
Internationally, the Bank of England raised interest rates by 25 basis points to 4.5% and struck a hawkish tone by removing recession possibilities from its economic projections, even though the British economy grew by just 0.1% in Q1. March GDP slumped 0.3% as poor weather and inflation hit the services sector. In Europe, investor confidence deteriorated in May, while a drop in German industrial production spurred recession fears. China’s data suggested weak domestic demand that may require more stimulus. New bank loans sank in April while imports contracted sharply. Factory gate deflation deepened, and consumer prices rose just 0.1% in April, the lowest rate in two years.
Current View
Climbing the wall of worry. That is what the stock market does and is doing. As i wrote about above, the daily debt debate has the created market nervousness. While no one really expects our government to default on its debts, the investors are worried. At least the broad stock market indexes took a break from debt-ceiling fears so far this week after both sides pointed to constructive talks. But a huge divide remains and all the happy talk in the world can’t hide deep divisions that could lead to a crisis as we near month’s end. The longer, lingering debate overhanging the market is what the Fed might do, or should do, with interest rates going forward. Today, two voting FOMC members poured cold water on rate pause hopes, talking up a June rate hike and warning that inflation “is still too high.” CME FedWatch odds for a June hike surged from 28% to 45% on the news. It stood at just 11% a week ago.
The Nasdaq composite, S&P 500 and Dow Jones Industrial Average gained 1.2% to 1.3% each. At 12,500, the Nasdaq stretched its stock market leadership in 2023 with a 19.4% gain. Volume rose more than 10% vs. the prior session in both main exchanges — exactly what you’d like to see on a solid up day. There are a lot of bricks in the wall of worry making for a high hurdle for the market to climb. Remember, it always does.
- Industry Group Strength: BEARISH. As of yesterday, 95 out the 197 groups I monitor are up year-to-date. 102 are down.
- New Highs vs. New Lows: BEARISH. In yesterday’s session, there were 127 new 52-week highs and 137 new 52-week lows.
- Dow Dividend Yield: BEARISH. The current yield for the Dow Jones Industrial Average is 2.19%. The 10-year Treasury now 3.64%.
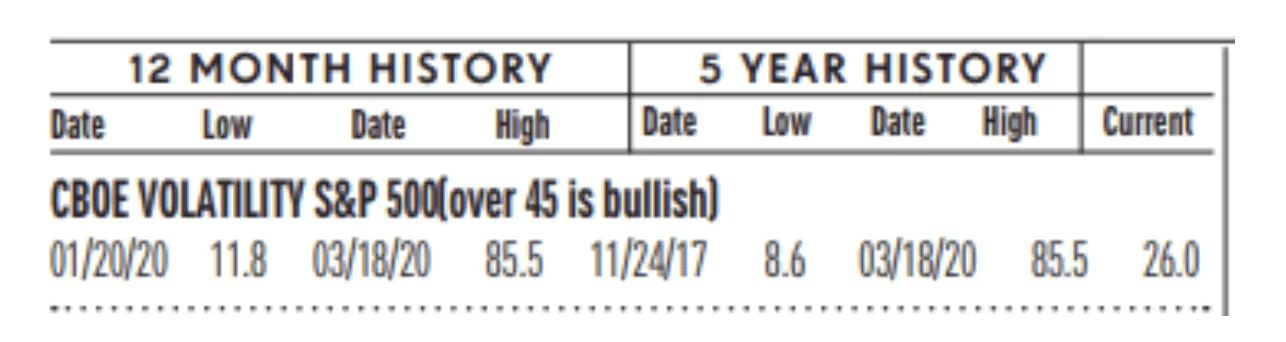
- Volatility Index: NEUTRAL. Volatility has been volatile. The “VIX” is now 16, down from 21 two weeks ago. The index is also known as the “Fear Index.” It is considered a contrarian indicator and therefore viewed as bullish as it rises indicating investors are becoming more fearful. The VIX:
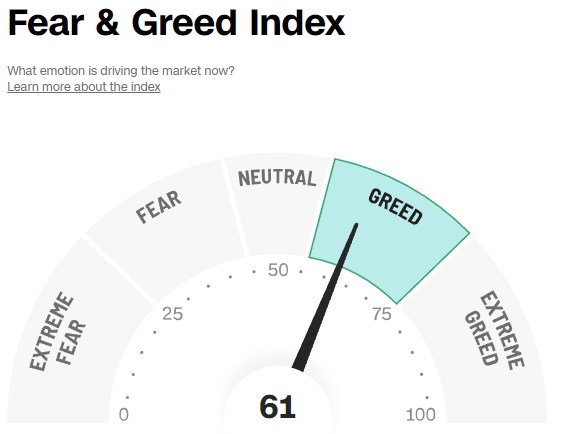
- Fear / Greed Index: NEUTRAL. Investors are driven by two emotions: fear and greed. Too much fear can create a condition of oversold/ undervalued stock prices. Too much greed can result in overbought/overvalued stock prices. The AAII Investor Sentiment Index is now neutral. BE FEARFUL WHEN OTHERS ARE GREEDY. At 61, the Fear & Greed Index is up from 52 two weeks ago.
- Bull / Bear Barometer: NEUTRAL. This secondary market indicator should also be viewed with a contrarian perspective. As of yesterday, according to the latest survey of stock market newsletter writers by Investor’s Intelligence, bullish sentiment is 45.2% and the bears came in at 24.7%. These readings are near the same as two weeks ago. Consider this a contrarian indicator because the crowd is often wrong at market tops and bottoms. In other words, extreme bullishness has been seen near several market tops in the past, while extreme bearishness has been seen at market bottoms.
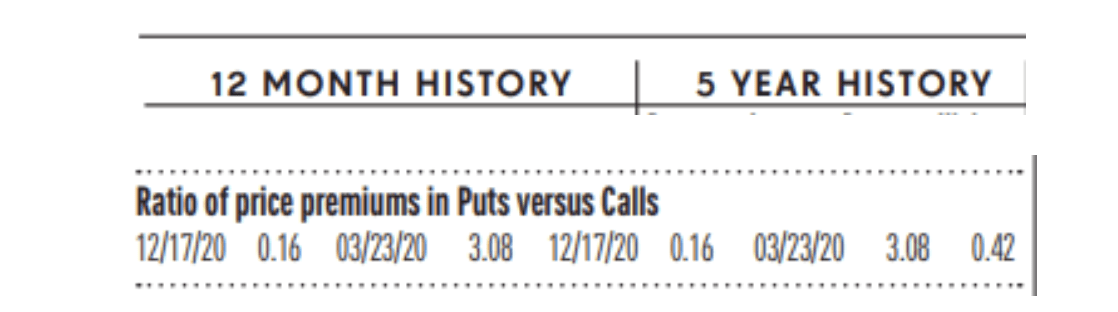
- Put / Call Ratio: NEUTRAL. The ratio of put-to-call options is 0.67, down from 1.00 two weeks ago. The put-call ratio tracks the mood of what options investors are doing, not just saying. They typically buy puts if they think a stock will decline and calls if they think it will rise. If they’re buying lots of puts, they see the market declining. And if they’re loading up on calls, they’re generally bullish. Historically, market bottoms occurred when the reading spikes to 1.2 or more. Market tops are often made when the reading is 0.6 or less. Note how reliable this is with respect to the February record low coinciding with the market high. Keep in mind this is also a contrarian indicator.
ECONOMIC UPDATES
Global Economic Indicators & Analysis:
POSITIVE INDICATORS
Jobless Claims Down: The number of Americans who applied for unemployment benefits in mid-May sank to 242,000, aided by efforts in Massachusetts to counter a recent spike in fraudulent claims. New jobless claims declined from 264,000 last week, the Labor Department said today. The figures are seasonally adjusted. The number of people applying for unemployment benefits is one of the best barometers of whether the economy is getting better or worse. New jobless claims have risen from fewer than 200,000 in January in a sign the labor market is cooling.
Philly Fed Index Up: The Philadelphia Federal Reserve said today its gauge of regional business activity rose to negative 10.4 in May from negative 31.3 in the prior month. Any reading below zero indicates deteriorating conditions. This is the ninth straight negative reading and the eleventh in the last twelve months. Economists polled by the Wall Street Journal expected a negative 20 reading in May. The barometer on new orders increased 13.8 points but remained at negative 8.9 in May. The shipments index rose slightly to negative 4.7. The measure on six-month business outlook worsened to negative 10.3 in May from negative 1.5 in the prior month.
New Home Construction Up: Construction on new homes rose 2.2% in April, as U.S. homebuilders continue to see strong demand from home buyers. Builders in the Midwest and West were particularly active this spring. Housing starts rose to a 1.4 million annual pace last month from 1.37 million in March, the government said yesterday, meaning that’s how many houses would be built over an entire year if construction took place at the same rate in every month as it did in April. The data roughly matched economists’ expectations on Wall Street. The numbers are seasonally adjusted. Both single and multi-family construction rose in April. The strength in new construction comes from strong demand from would-be home buyers who don’t have many options in the resale market. Building permits, a key indicator of the pace of future construction, fell 1.5% to a 1.42 million rate. The decline was larger than expected. The construction pace of single-family homes rose 1.6% in April while apartment building rose 5.2%. Many homeowners don’t see an incentive to sell and face a tough housing market as 14 million mortgages were refinanced during the pandemic years and most of them were secured with an ultra-low mortgage rate. In contrast, the mortgage rate for a 30-year is double that rate. Therefore, homebuilders are seeing – and expect to continue seeing – strong demand from home buyers who don’t see many options in the resale market.
CPI Trending Lower: U.S. consumer prices rose 0.4 % in April, up from a 0.1% gain in the prior month, the Labor Department said last Wednesday. However, over the past 12 months, consumer inflation increased 4.9% and that’s down from a 5% year-on-year increase in March and also down from a 9.1% rate last summer, which was the fastest pace since 1981.Economists polled by the Wall Street Journal had forecast the CPI increasing 0.4% and advancing 5.0% over the past year. Inflation minus food and energy, the so-called core rate, rose 0.4% in April for the second straight month, matching economists’ forecasts. The core rate increased 5.5% over the past 12 months down from a 5.6% gain in March and that’s down from a high of 6.6% last fall. On a three-month annualized basis, headline inflation was up 3.2% while core inflation was 5.1%. The CPI data is expected to play a big role in whether the Federal Reserve hikes interest rates again in June though markets are expecting no change in rates.
PPI Trending Lower: U.S. producer prices rose 0.2% in April, the Labor Department said last Thursday. Economists polled by the Wall Street Journal had forecast the PPI would rise 0.3%. In the 12 months through April, the PPI increased 2.3%. It follows a 2.7% gain in March. This is the lowest rate since January 2021. Most of the gain in producer prices was due to an increase in services. Inflation is moderating at the consumer and producer levels. This is adding to market expectations that the Federal Reserve will refrain from raising interest rates further at the next meeting in mid-June.
Industrial Production Up: U.S. industrial production rose 0.5% in April after two flat months, the Federal Reserve reported Tuesday. The gain in April was above expectations of a 0.1% gain, according to a survey by The Wall Street Journal, but enthusiasm was tempered by downward revisions to both February and March. Capacity utilization rose to 79.7% in April from a revised 79.4% in the prior month. The reading was in line with economists forecasts. Manufacturing output jumped 1% in April after a 0.8% drop in the prior month. Motor vehicles and parts output rose 9.3% after a 1.9% decline in the prior month. Excluding autos, manufacturing was up 0.4%.
WEAK INDICATORS
LEI Down: The U.S. leading economic index fell 0.6% in April and declined for the 13th month in a row, pointing once again to a potential recession later in the year. Economists polled by the Wall Street Journal had forecast a 0.6% drop. The leading economic index, also known as the LEI, is a gauge of 10 indicators designed to show whether the economy is getting better or worse. The report was published by the Conference Board today. Eight of the 10 indicators tracked by the Conference Board fell in April.
Import Prices UP: The cost of U.S. imported goods rose 0.4% in April, the Labor Department said last Friday. This was the first increase this year. Economists polled by the Wall Street Journal had forecast a 0.3% gain. Over the past 12 months, the costs of imports has dropped 4.8%. That followed a 12.5% gain in the prior year0 The cost of imported fuel rose 4.5% in April after a 3.9% drop in the prior month. This was the first increase since last June. The cost of imports excluding fuel were flat in April after a 0.5% decline in the prior month. Over the past year, nonfuel import prices are down 1.9%.
Empire State Index Down: The New York Fed’s Empire State business-conditions index, a gauge of manufacturing activity in the state, plunged 42.6 points in May to negative 31.8, the regional Fed bank said Monday. The only larger monthly decline came at the start of the pandemic. Economists had expected a reading of negative 5, according to a survey by the Wall Street Journal. Any reading below zero indicates deteriorating conditions. The index for new orders dropped 53.1 points to negative 28 in May, reversing completely a sharp 46.7-point gain in April. The shipments index fell 40.3 points to negative 16.4, almost reversing a 37.3-point gain in the prior month. Monday’s report of decline wiped out all that improvement from last month and adds to fears about a recession.
Retail Sales Down: Sales at U.S. retailers rebounded 0.4% in April largely because of strong demand for new autos and higher consumer spending online, according to a report Tuesday, offering a respite from a broad slowdown in consumer spending. Sales had been forecast to rise 0.8%, based on a Wall Street Journal poll of economists. Retail sales are a big part of consumer spending and offer clues about the strength of the economy. Before April’s increase, retail sales had fallen in four of the prior five months. Retail sales rose a somewhat stronger 0.6% in April if auto dealers and gas stations are excluded. Car and gasoline purchases exaggerate overall retail spending. Sales of new vehicles and auto parts, an up-and-down category, rose 0.4% last month.
An easy way to get my ERPE Excerpts is by “text-to-subscribe”. By simply texting to the number 22828 and entering the word erpe excerpts, a prompt is sent to enter an email address and done! You will then receive my bi-monthly market and economic updates. Please pass this on.
Call me if you have any questions. I am always happy to help!
John J. Gardner, CFP®, CPM®.
Blackhawk Wealth Advisors, Inc.
4125 Blackhawk Plaza Circle, Ste. 260 Danville, CA. 94506
Phone: 888-985-PLAN ·
Email: jg@blackhawkwealthadvisors.com
BLACKHAWKWEALTHADVISORS.COM
For my Market Monthly podcast, click on the link below. I provide a review of global stock market highlights over the past month and preview of the month ahead. Forward insights and perspectives are based on current financial market and economic trends with an emphasis on relevant developments in various areas from Fed policy to company earnings announcements.