


Bi-MONTHLY MARKET ANALYSIS &
ECONOMIC UPDATES
August 17, 2023
Peak 65
12,000 a day Turning 65 in ’24

Next year more Americans will reach the traditional retirement age of 65 in the same year than at any time in history. That’s “Peak 65”. According to the U.S. Census Bureau’s population projections, about 12,000 people will turn 65 every day next year. Twelve thousand people a day – that’s a lot. In fact, it is about 4.4 million in 2024. Further, calculations figure that by 2030, all of America’s “baby boomers” — those born from 1946 through 1964 — will be 65 or older. Peak 65 is not just a major demographic and retirement planning milestone for America and the greatest retirement surge in history; the development has great significance. The impact from the aging boomer generation will affect health care, Social Security, taxes, investing, and retirement planning for the next generation and beyond. At the very least, the legs of the “three-legged stool of retirement planning” metaphor — employer pensions, personal savings and Social Security — will wobble. The Social Security “leg” of the retirement stool is likely to wobble the most. With the rapid growth in retirees, pressure will rise on the Social Security system. This year, trustees for Social Security and Medicare calculate that Social Security will be able to pay 100% of scheduled benefits until 2033. Without additional funding, they forecast benefits would fall after that. While the question of Social Security’s sustainability is not new, Peak 65 is shining more light on the issue. In essence, the math is simple: the number of workers contributing to the program is growing more slowly than the number of beneficiaries receiving monthly payments. According to the Social Security Administration, in 1960 — nearing the end of the baby boom generation — there were 5.1 workers per Social Security beneficiary; that ratio dropped to 2.8 in 2022. By 2035, the trustees estimate 2.3 workers will be contributing for each beneficiary. This year, an average of almost 67 million Americans per month will receive a Social Security check, totaling $1 trillion in benefits paid during the year, the SSA says.
Plan to plan your plan
As is often said, hope is not a plan. While today’s, and tomorrow’s, retirees may hope that H.R. 976 is passed (the recent tax bill proposal to make the 2017 tax law changes that reduced individual and capital gain tax rates permanent), putting a plan in place would be more prudent. Strategic tax planning before and during retirement can result in retaining resources and lowering liabilities. Now is a good time to plan retirement income, investment allocation and Social Security and Medicare benefits. If you do receive less Social Security income during retirement than expected, plan to replace it. Wealth preservation requires effective estate and tax planning. I have long said, “Proper portfolio planning promotes positive performance.” Planning will also help preserve principle, reduce estate erosion and provide peace of mind that your life’s savings will last your life and beyond.
If you will celebrate your 65th birthday next year, Happy 65th! in advance. If not, join me in wishing a happy 65th to the 4.4 million Americans that do!
TAKING PERSPECTIVE…
Proper Perspective: In our hectic and often hard to comprehend world, it is very easy to lose perspective. You may agree it is sometimes difficult to see the big picture. The media often doesn’t help with this, but unfortunately instead encourages us to see things in a most negative light. Here is hopefully a pause to gain positive perspective.

Famous Quote On This Day: “I want to be an artist, an actress with integrity.”
~~ Marilyn Monroe, 1962
What Happened On This Day, August 17, 1934 – Adolf Hitler becomes Fuhrer (leader).
MARKET ANALYSIS
INDICATORS OF INTEREST:
- Market’s Current Signal: Uptrend Under Pressure. Analysis of the stock market over 130 years of history shows we can view it in terms of three stages – market in uptrend, uptrend under pressure and market correction. I analogize this to a traffic signal’s changing colors from green to yellow and then to red. Since the 1880’s, this perspective has led to investment out-performance relative to market indexes. This is due to trend analysis which determines risk reducing, return enhancing market entry and exit points. The U.S. stock market’s current signal is Uptrend Under Pressure.
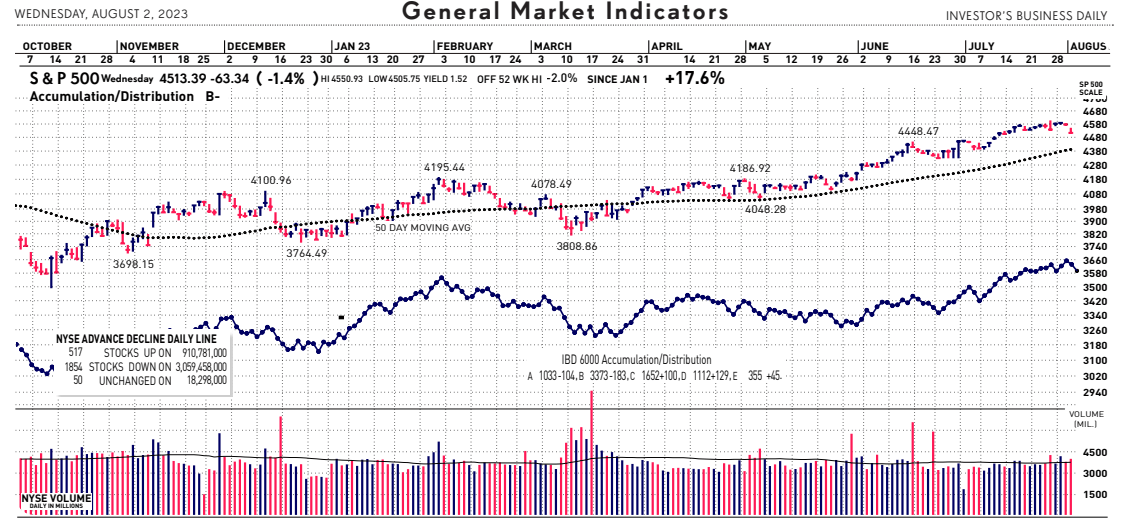
The Stock Market Trend: Uptrend Under Pressure. After the regional banking crisis in mid-March, the general market weakened to Market in Correction March 15. In a resilient rally, the trend turned bullish with a signal change to Market in Confirmed Uptrend on March 29. That trend signal flashed caution and indicated weakness on April 25 as the market’s trend changed to Uptrend Under Pressure. Then, on May 10 the market’s trend changed again, to Confirmed Uptrend. The broad market remained in a Confirmed Uptrend until yesterday. The steep, broad and high volume bearish sell-off yesterday caused a weaker stock market trend outlook to Uptrend Under Pressure. Bull markets are not immune to sharp, temporary sell-offs. In a nutshell, sharp drops in heavier turnover in the stock market like the one yesterday deliver the earliest signs that the bull run is suffering from fatigue.
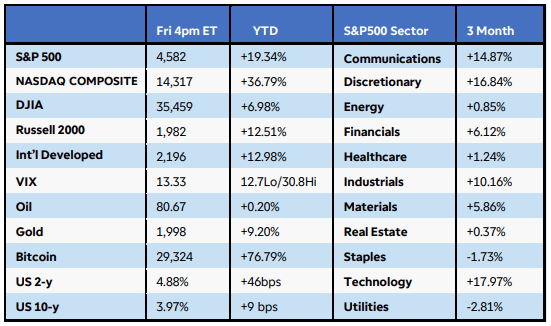
Here are key market levels as of Monday, August 17:
Recapping Last Week
U.S. equities rose as investors assessed better-than-expected economic data, central bank actions, and the latest batch of corporate earnings. The Nasdaq Composite gained over2%, while the S&P500 and Russell 2000 added 1%+. Seven of 11 S&P500 sectors gained ground, led by a 5% jump in communications. Strong revenue and earnings growth at Meta, Microsoft, and Alphabet were fueled by a pickup in advertising and cloud storage. Crude oil prices soared 5% as the global demand forecast improved, sending energy stocks higher despite disappointing earnings from giants Exxon Mobil and Chevron. The first estimate of U.S. Q2 GDP growth came in above estimates at 2.4%, powered by solid consumer spending, while inflation cooled further in June. The Core PCE Index increased just 0.2% month-over-month, and the year-over-year gain of 4.1% was the lowest since September 2021. Compensation costs rose less than expected, fueling hopes that the Fed’s 25bps rate hike at last week’s meeting may be the last in this cycle. Treasury yields lifted as the economic data showed continued improvement. Consumer confidence reached a two-year high in July, while durable goods orders for June rose a much better than-expected 4.7%. Weekly jobless claims sank to 221K, while evidence of a bottoming housing market emerged. Pending home sales increased in June for the first time in 4 months, although new homes sales were hampered by high borrowing costs.
Internationally, global PMIs stayed in expansion in the U.S. but showed signs of weakening business activity in the UK and Europe. The European Central Bank raised rates for a ninth consecutive time, but sentiment is shifting towards a pause. German inflation fell in July and business sentiment dropped for a third straight month as recession fears persisted. Australia’s CPI slowed to 6% in the June quarter from 7% prior. Lastly, the Bank of Japan surprised markets by loosening its yield curve control, expanding the range for 10-year bonds to 100bps from 50bps around the 0% target.
Current View
Yesterday, as I mentioned above, crack in the bull’s armor. The Nasdaq posted its biggest single-session drop in more than five months on yesterday, and volume rose sharply. Of the197 industry groups I monitor daily, more than 20 groups fell 3% or more yesterday. This bearish action was enough to trigger a weaker stock market trend outlook to Uptrend Under Pressure. While earnings reports certainly deserved much of the blame, perhaps the primary catalyst for the stock market drop came from the bond markets. In an unexpected announcement Tuesday night, Fitch Ratings downgraded U.S. Treasury securities. The bond rating agency lowered its view on U.S. government debt from a top-rating triple-A grade to AA+. Treasury Secretary Janet Yellen, a former chair of the Federal Reserve, called the decision “arbitrary” and based on “outdated data.” Still, the stock market sold off hard. The last time U.S. debt securities were hit with a credit rating downgrade was 12 years ago, August 5, 2011. On the next trading day, the S&P 500 index suffered a 6.66% sell-off. That marked its worst single-session decline since Dec. 1, 2008. So, the mauling in the stock market yesterday was not as terrible. Yet the losses among some growth stocks was quite brutal.
Bull:Bear Barometer
As I have been discussing with clients recently, “It’s so bullish, it’s bearish”. Keeping an eye on investor sentiment is helpful for a reliable indicator of major direction changes in the stock market. Excessive optimism can hint at a growing absence of fresh new buyers to help propel stocks higher and has historically preceded market tops. The current weekly Investors Intelligence survey, which I note below, showed bulls as a percentage of all newsletter editors polled increasing to 57.1% yesterday vs. 55.6% last week. That’s not only just under the November 2021 peak reading of 57.2%, but it now exceeds the 55% initial caution level, which says to prepare a more defensive strategy. Bears fell to 18.6% after a small rebound to 19.4% last week.
- Industry Group Strength: BULLISH. As of yesterday, 123 out the 197 groups I monitor are up year-to-date. 74 are down.
- New Highs vs. New Lows: BEARISH. In yesterday’s session, there were 106 new 52-week highs and 109 new 52-week lows.
- Dow Dividend Yield: BEARISH. The current yield for the Dow Jones Industrial Average is 2.14%. The 10-year Treasury now 4.17%.
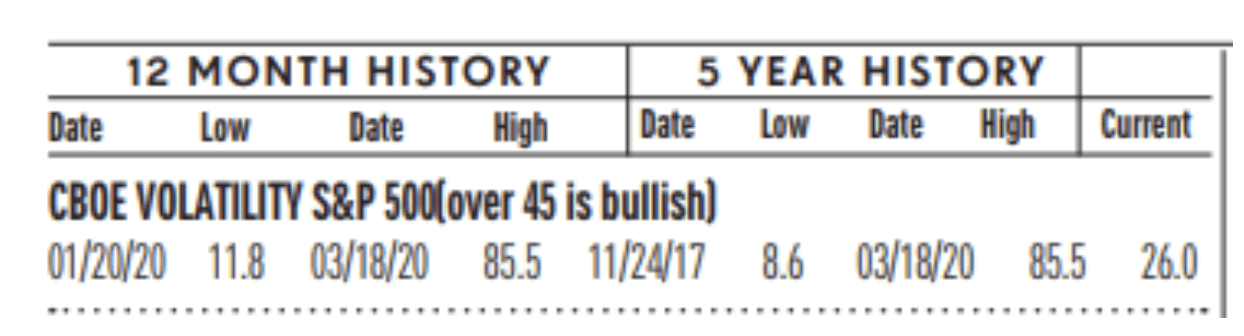
- Volatility Index: BEARISH. Volatility has been volatile. The “VIX” is now 16, up from 14 two weeks ago. It is now at its lowest level since February 20, of 2020. The index is also known as the “Fear Index.” It is considered a contrarian indicator and therefore viewed as bullish as it rises indicating investors are becoming more fearful. The VIX:
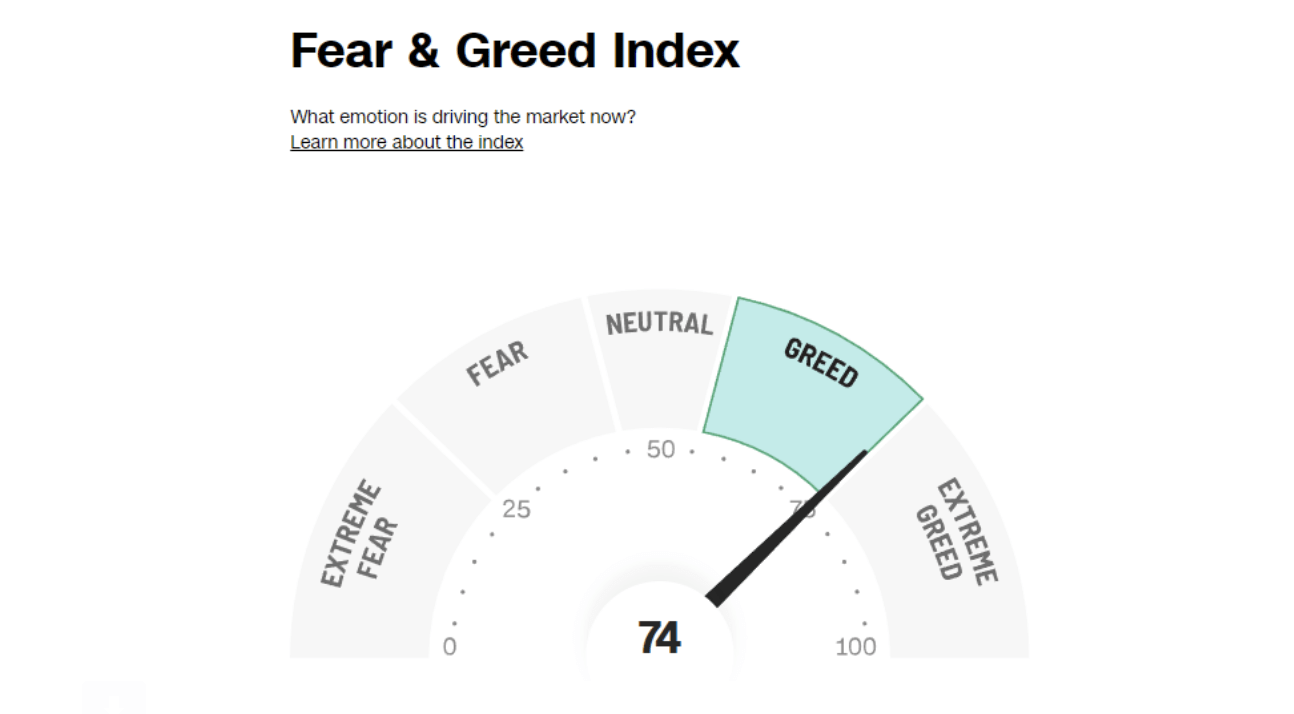
- Fear / Greed Index: BEARISH. Investors are driven by two emotions: fear and greed. Too much fear can create a condition of oversold/ undervalued stock prices. Too much greed can result in overbought/overvalued stock prices. The AAII Investor Sentiment Index is now neutral. BE FEARFUL WHEN OTHERS ARE GREEDY. At 74, the Fear & Greed Index is up from 81 two weeks ago.
- Bull / Bear Barometer: BEARISH. This secondary market indicator should also be viewed with a contrarian perspective. As of yesterday, according to the latest survey of stock market newsletter writers by Investor’s Intelligence, bullish sentiment is 57.1% and the bears came in at 18.6%. Bullish sentiment is up from 54.3 two weeks ago, while the bearish read is down from 20.1% in the last two weeks. Consider this a contrarian indicator because the crowd is often wrong at market tops and bottoms. In other words, extreme bullishness has been seen near several market tops in the past, while extreme bearishness has been seen at market bottoms.
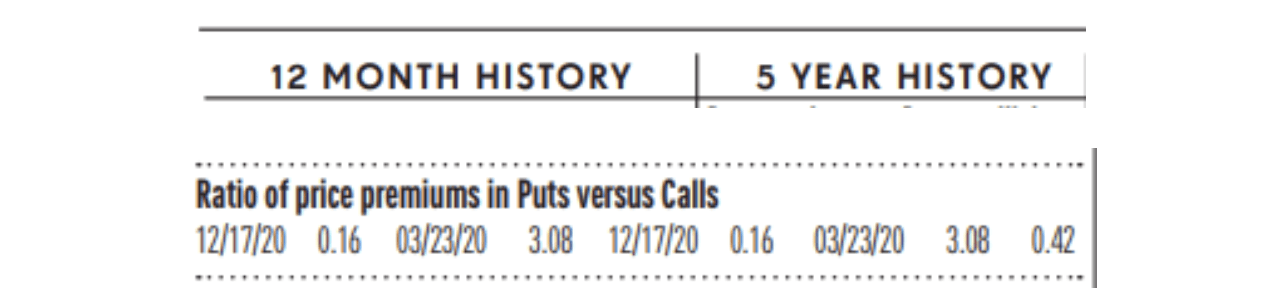
- Put / Call Ratio: BEARISH. The ratio of put-to-call options is 0.32, up from 0.18 two weeks ago. The put-call ratio tracks the mood of what options investors are doing, not just saying. They typically buy puts if they think a stock will decline and calls if they think it will rise. If they’re buying lots of puts, they see the market declining. And if they’re loading up on calls, they’re generally bullish. Historically, market bottoms occurred when the reading spikes to 1.2 or more. Market tops are often made when the reading is 0.6 or less. Note how reliable this is with respect to the February record low coinciding with the market high. Keep in mind this is also a contrarian indicator.
ECONOMIC UPDATES
Global Economic Indicators & Analysis:
POSITIVE INDICATORS
Labor Market Still Tight: The number of Americans who applied for unemployment benefits last week fell by 11,000 to 239,000, underscoring the strength of the labor market and remarkably low level of layoffs taking place in the economy. Unemployment claims typically rise when the economy weakens and a recession approaches. Yet claims still show a low number of job losses in a surprisingly resilient U.S. economy. The economy is likely to keep expanding and stay out of a recession if unemployment remains low. The jobless rate, at 3.6%, is near a 55-year bottom.
Philly Fed Optimistic: “The Federal Reserve could be at the point where it doesn’t need to raise interest rates further,” said Philadelphia Fed President Patrick Harker, last Tuesday. “Absent any alarming new data between now and mid-September, I believe we may be at the point where we can be patient and hold rates steady and let the monetary policy actions we have taken do their work,” Harker said. In his remarks, Harker cautioned that he was not thinking about cutting interest rates. Harker said that he thinks the economy is “on the flight path to the soft landing we all hope for and that has proved quite elusive in the past.
Consumer Sentiment Up: The University of Michigan’s gauge of consumer sentiment inched down to a preliminary August reading of 71.2 after hitting a 22-month high of 71.6 in the prior month. Sentiment has been boosted by waning recession fears and disinflation in grocery store prices.
US Retail Sales Soar: Sales at U.S. retailers rose 0.7% in July and posted the biggest increase in six months, helped by strong Internet purchases on Amazon Prime Day. Retail sales represent about one-third of all consumer spending and usually offer clues on the strength of the economy. Retail sales have tapered off in the past year because of a shift in consumer spending patterns, but they are still rising fast enough to signal the economy is in good shape.
Initial Jobless Claims Fall: The number of people already collecting jobless benefits fell by 8,000 to 1.64 million in the week ended July 29. Continuing claims are down from a high of 1.86 million in mid-April.With initial and continued jobless claims moving lower, the economy seems to be stabilizing after a wobbly patch that began in mid-2022 as prices of gasoline and food surged. Amidst all of the swings in applications for unemployment insurance in recent months, the number of people actually collecting benefits has been trending lower, a far more reliable indication of what is transpiring on the layoff front.
WEAK INDICATORS
CPI Creeps Back Up: U.S. consumer prices rose a mild 0.2% in July, but the rate of inflation rose for the first time in more than in a year in a sign it’s going to take a while to get the rise in the cost of living fully under control. The yearly rate of inflation rose to 3.2% from to 3% in the prior month, the consumer price index showed. It was the first increase in13 months. The so-called core rate of inflation, meanwhile, also rose 0.2% last month. The core rate omits volatile food and energy costs. Inflation has slowed sharply in the first half of 2023, but further falls this year are unlikely to come as easily.
PPI Surprise Increase: The U.S. producer price index rose 0.3% in July, the Labor Department said last Friday, up from a revised flat reading in June and the largest gain since January. PPI surprised to the upside in July. While we do not expect further rate hikes this year, if inflation surprises to the upside and the labor market and growth do not slow, another increase in interest rates cannot be ruled out in 2023.
Empire State Manufacturing Index Plummets: The New York Federal Reserve’s Empire State business conditions index, a gauge of manufacturing activity in the state, fell 20.1 points in August to negative 19, the regional Fed bank said Tuesday. This is the first negative reading since May. Any reading below zero indicates contraction in activity. The factory sector has been hurt by tighter lending standards, elevated borrowing costs and softening business demand.
US Non-Farm Payroll Softening : The U.S. added a more modest 187,000 new jobs in July, perhaps a sign the economy is cooling enough to drive inflation lower and even stave off further increases in interest rates. The increase in hiring in July was concentrated in just a handful of areas, mostly health care and social assistance. While the economy is still creating lots of new jobs, fewer industries are hiring. The percentage of firms adding jobs vs. the share reducing them fell close to a record low last month. Another sign of a softening labor market: The number of hours people work fell a tick to 34.3 and matched a post-pandemic low. Businesses tend to cut hours before resorting to layoffs when the economy slows.
NFIB Confidence Raises Slightly, Still Low: Confidence among U.S. small-business owners rose in July, but remained below the long-term average as high inflation and a tight labor market continue to weigh on businesses. The percentage of owners expecting an improvement in business conditions in the next six months rose by 10 points to a net negative 30, the highest reading in nearly two years but still very low compared with the historical average. This marks nearly two straight years that confidence has remained below the historical average.
LEI Down Again: The leading economic index fell 0.4% in July and declined for the 16th month in a row, but other measures of the economy suggest a recession is far off. The leading index is a gauge of 10 indicators designed to show whether the economy is getting better or worse. Seven of the 10 components fell in July
Many economists have backed off longstanding predictions of recession or have pushed out a target date until next year. The Conference Board has not.
The U.S. economy is still not out of the danger zone. Interest rates have risen rapidly over the past year as the Federal Reserve sought to suffocate high inflation. Higher borrowing costs typically slow the economy.
Home Builder Confidence Falls for First Time in 2023: Builder confidence waned in August as the 30-year mortgage rate surged, dampening U.S. home-buying interest. Despite a persistent shortage of homes on the market for resale, builders have lost confidence in the late summer amid declining customer traffic from higher mortgage rates, as well as challenges in the construction process.
Buyers are getting spooked by rising interest rates, which pushed the National Association of Home Builders monthly confidence index down 6 points to a reading of 50 in August, the trade group said Tuesday.
Call me if you have any questions. I am always happy to help!
John J. Gardner, CFP®, CPM®.
Blackhawk Wealth Advisors, Inc.
3860 Blackhawk Rd. Ste. 160 Danville, CA. 94506
Phone: 888-985-PLAN · Email: jg@blackhawkwealthadvisors.com
BLACKHAWKWEALTHADVISORS.COM
For my Market Monthly podcast, click on the link below. I provide a review of global stock market highlights over the past month and preview of the month ahead. Forward insights and perspectives are based on current financial market and economic trends with an emphasis on relevant developments in various areas from Fed policy to company earnings announcements.
Link to my Market Monthly Podcast