

ERPE EXCERPTS
Bi-MONTHLY MARKET ANALYSIS &
ECONOMIC UPDATES
April 6, 2023
Don’t Realize the Unrealized
A look back at the Covid Crash
A loss in an investment is not a real loss until you make it real by “realizing” it by selling. Until then it is “unrealized”, or only a loss on paper; you see a decline on your account’s statement. Seeing a drop of 20 or 30%, or more, in your stock portfolio can tempt you to sell and get out of the market. Bear markets are a true test of an investor’s emotional fortitude. It is critical to your long-term investment success to pass this test and overcome the emotional urge to sell. The fear of being in (FEBI) can be a more powerful emotion than FOMO (the fear of missing out). Getting out near bear market lows can make a bad thing worse. Just a reminder of the 2020 Covid market crash serves as a good example of the benefit of not letting the bear scare you away. Three years ago, on March 27, 2020, I wrote a note to clients titled, “Normally Abnormal”. As the stock market had just collapsed over 30% in a about 30 days, the bear market then caused many to realize losses that soon turned into significant gains. I, of course, had no way of knowing the bear market has days away of bottoming and a stunning bull market was about to surprise us all. An investor who realized the unrealized losses lost twice; one by losing money and the other by missing making money in the days, weeks and next year ahead. Here’s what I wrote about three years ago…
Normally Abnormal
Can’t surprise you anymore with 1,000 point Dow down days. What should surprise you, though, is a 13% gain for the Dow in a week (from last Friday’s close). More of a shock and awe is the Dow’s move up from Monday’s close – – a 16.4% jump. This was the best week for the Dow since 1931. So, today we had another – what has become normal – near 1,000 point loss for the Dow. For the week, the normally abnormal massive move up in the Dow underscores the market’s extreme volatility. This week’s historical gain for the Dow is best accentuated by its record setting climb Tuesday. In Tuesday’s Market Update I wrote, “Today I get to share my thoughts about the biggest point up day in history. The Dow flew 2,113 points higher today. That is nearly a 13% jump. Today’s percentage gain was the greatest for a day since 1933.” Someone please share with me another word for ‘volatility’, I getting bored with repeating it.
As I noted in Friday’s Market Update , “…. This amount of fiscal stimulus is staggering. It is being called “Liquidity Infinity” . The Federal Reserve is a big part of what happened – and what has been happening. As of this minute, President Trump has just signed the largest economic stimulus package in history. Expect even more before the war against the coronavirus is won. In borrowing from “Buzz Lightyear”, we have liquidity to infinity and beyond!
I said in my Investor’s Edge TalkPod podcast last week , “It’s like when your raffle ticket number is called…you must be present to win.” Do not be out of the market when these huge upturns occur. Peter Lynch said, “More people have lost money waiting for corrections and anticipating corrections than in the actual corrections.”
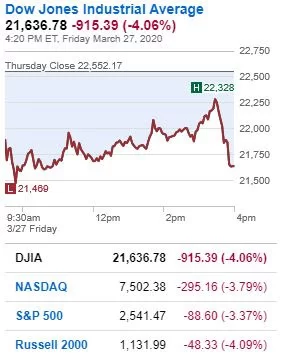
Here’s today’s scorecard – nearly another 1,000 point Dow down day:
This past week, the bull-to-bear ratio among stock market professionals polled by Investors Intelligence indicates that pessimism is widespread. That’s actually good for stocks. This contrarian indicator is worth noting. New bull markets have historically emerged from a universe filled with pessimism.
Remember what super star investor Sir John Templeton said. “There will be bear markets about twice every 10 years and recessions about twice every 10 or 12 years but nobody has been able to predict them reliably. So the best thing to do is to buy when shares are thoroughly depressed and that means when other people are selling.”
Well, that’s what I wrote on March 27, 2020. I hope that helps you keep perspective on extreme market declines and the real cost of realizing the unrealized when it comes to stock losses on paper.
TAKING PERSPECTIVE…
Proper Perspective: In our hectic and often hard to comprehend world, it is very easy to lose perspective. You may agree it is sometimes difficult to see the big picture. The media often doesn’t help with this, but unfortunately instead encourages us to see things in a most negative light. Here is hopefully a pause to gain positive perspective.

Famous Quote On This Day: “As I slowly grow wise I briskly grow cautious.”
~ ~ Mark Twain, 1887
What Happened On This Day, April 6, 1896 – First modern Olympic Games opens in Athens, Greece, after a 1500 year ban.
MARKET ANALYSIS
INDICATORS OF INTEREST:
- Market’s Current Signal: Market in Confirmed Uptrend. Analysis of the stock market over 130 years of history shows we can view it in terms of three stages – market in uptrend, uptrend under pressure and market correction. I analogize this to a traffic signal’s changing colors from green to yellow and then to red. Since the 1880’s, this perspective has led to investment out-performance relative to market indexes. This is due to trend analysis which determines risk reducing, return enhancing market entry and exit points. The U.S. stock market’s current signal is Market in Confirmed Uptrend.
The Stock Market Trend: Market in Correction. The market’s current trend indicator weakened to Market in Correction March 15. It had flashed Under Pressure March 9. Fears, uncertainty and painful memories of the GFC has hit investor sentiment and taken below key support levels.
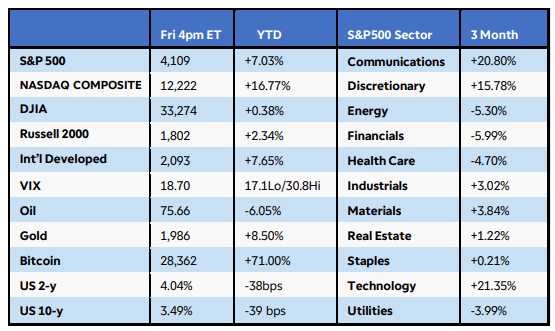
Here are key market levels as of Monday, April 3:
Recapping Last Week
Concerns about the banking sector eased and inflation numbers moderated, lifting U.S. equities to solid gains for the week and first quarter. The S&P500 and Russell 2000 Indexes rose 3.5-4%, while the Nasdaq Composite added 3.4% and soared nearly 17% in Q1, its best performance since Q4 2020. All 11 S&P500 sectors finished positive, with energy, basic materials, and industrials leading the way. Crude oil jumped about 9% as U.S. stockpiles unexpectedly fell to a two-year low while disruptions to Iraqi exports tightened global supply. U.S. Treasury yields spiked last Monday after a buyer was found for Silicon Valley Bank’s assets before leveling off the rest of the week.
Internationally, Eurozone CPI tumbled to 6.9% year-over-year in March from 8.5% the prior month, largely due to a drop in energy costs. But core inflation reached a new record high of 5.7% over the past year, pressuring on the European Central Bank to raise rates further with wage growth at 5-6%. In China, services sector PMI surged to 58.2 in March, a ten-year high, while manufacturing stayed in expansion at 51.9. Finally, Japan’s Tokyo Core CPI eased in March as utility bill subsidies kicked in, but demand-side pressures persisted when stripping out food and energy prices
Current View
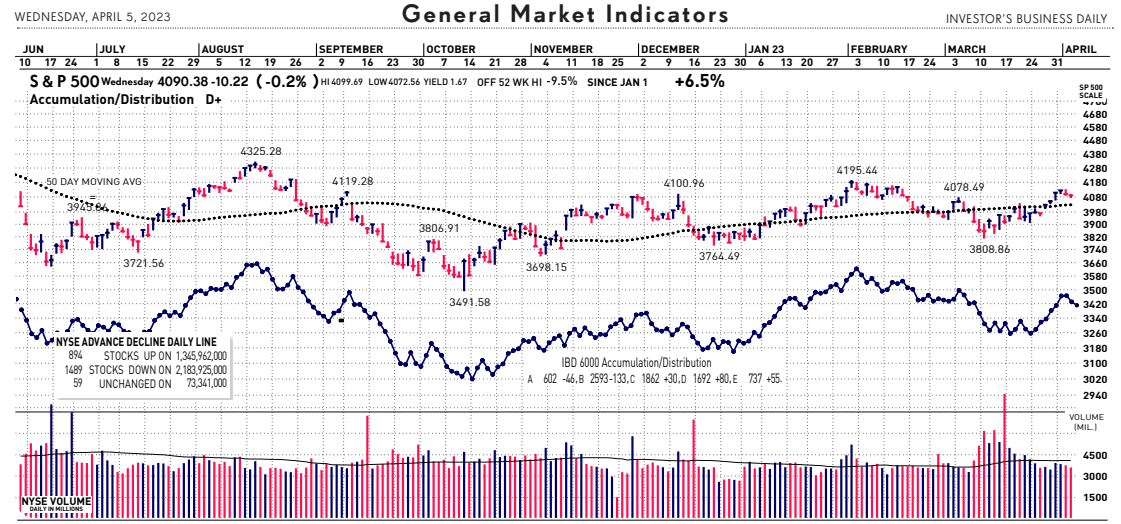
Stock market indexes fell for a second day Wednesday, continuing a pullback driven by weak jobs data and rising commodity prices. Big Tech, which led the market in recent weeks, got sold aggressively. The holiday-shortened trading week isn’t helping at all, with March nonfarm payrolls scheduled for Friday, when most world markets are closed for the long Easter weekend. On a positive note, the broad market remains in a “confirmed uptrend,” with major indexes trading above their 200-day moving averages after bullish follow-through days. From a macro view, the market closed March strongly with convincing bullish action. The market’s trend indicator flipped positively to “Confirmed Uptrend” from “Market in Correction”. From a more myopic perspective, the market’s rally has been less bullish as it has been led by only a small percentage of mostly mega-cap tech stocks. Broader market participation to the upside would give more life to the next market bull.
Industry Group Strength: BEARISH. As of yesterday, 88 out the 197 groups I monitor are up year-to-date. 109 are down.
New Highs vs. New Lows: BEARISH. In yesterday’s session, there were 49 new 52-week highs and 98 new 52-week lows.
Dow Dividend Yield: BEARISH. The current yield for the Dow Jones Industrial Average is 2.23%. The 10-year Treasury now 3.28%.
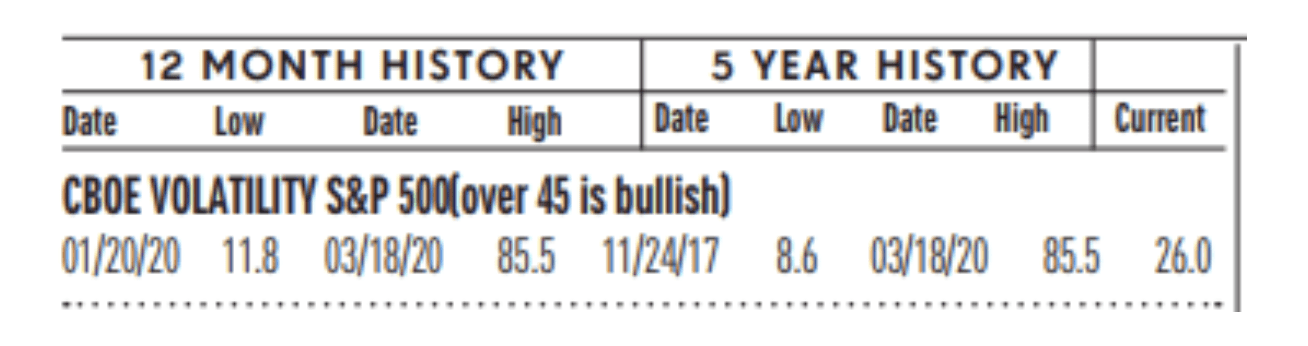
Volatility Index: NEUTRAL. Volatility has been volatile. The “VIX” is now 18.7, down from 21 two weeks ago. The index is also known as the “Fear Index.” It is considered a contrarian indicator and therefore viewed as bullish as it rises indicating investors are becoming more fearful. The VIX:
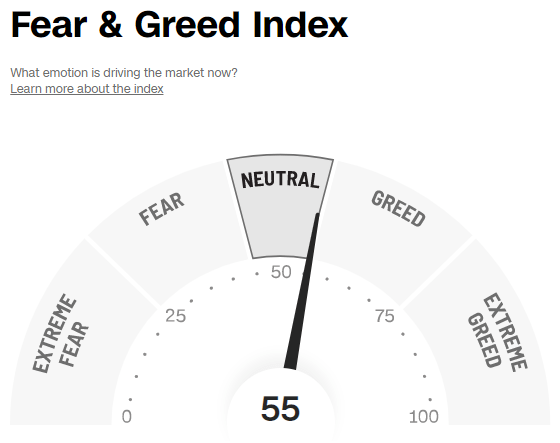
- Fear / Greed Index: NEUTRAL. Investors are driven by two emotions: fear and greed. Too much fear can create a condition of oversold/ undervalued stock prices. Too much greed can result in overbought/overvalued stock prices. The AAII Investor Sentiment Index is now neutral. BE FEARFUL WHEN OTHERS ARE GREEDY. At 55, the Fear & Greed Index is up from 40 two weeks ago.
- Bull / Bear Barometer: NEUTRAL. This secondary market indicator should also be viewed with a contrarian perspective. As of yesterday, according to the latest survey of stock market newsletter writers by Investor’s Intelligence, bullish sentiment is 48.6% and the bears came in at 25%. The bullish read is up from 2-weeks ago when it was about 39.7%. The bearish read is also up from 28.8% 2 weeks ago. Consider this a contrarian indicator because the crowd is often wrong at market tops and bottoms. In other words, extreme bullishness has been seen near several market tops in the past, while extreme bearishness has been seen at market bottoms.
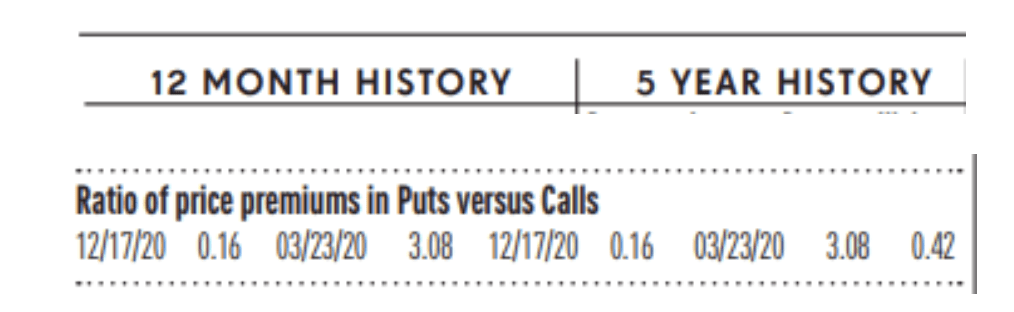
- Put / Call Ratio: BEARISH. The ratio of put-to-call options is .70, down from .88 two weeks ago. The put-call ratio tracks the mood of what options investors are doing, not just saying. They typically buy puts if they think a stock will decline and calls if they think it will rise. If they’re buying lots of puts, they see the market declining. And if they’re loading up on calls, they’re generally bullish. Historically, market bottoms occurred when the reading spikes to 1.2 or more. Market tops are often made when the reading is 0.6 or less. Note how reliable this is with respect to the February record low coinciding with the market high. Keep in mind this is also a contrarian indicator.
ECONOMIC UPDATES
Global Economic Indicators & Analysis:
POSITIVE INDICATORS
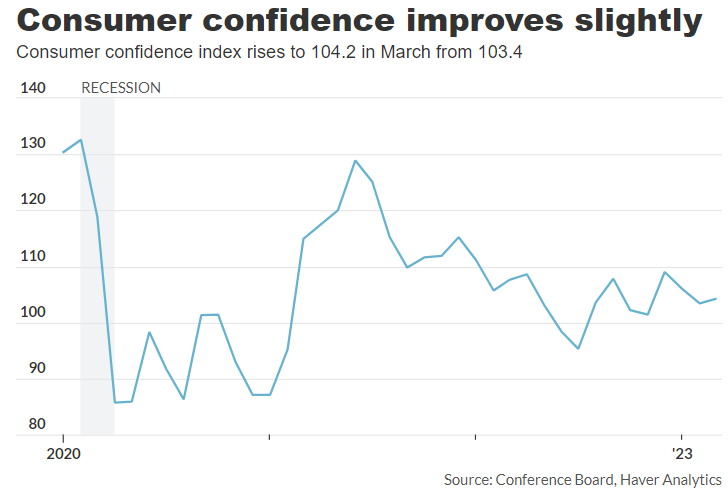
Consumer Confidence Up: A survey of consumer confidence rebounded slightly in March to 104.2, reflecting ongoing strength in the labor market and a bit more hope about the future of the economy. The closely followed index increased 0.8 points from a revised 103.4 in the prior month, the Conference Board said last Tuesday. The February reading was the lowest in three months. Economists polled by The Wall Street Journal had forecast the index to register 100.7.Consumer confidence tends to signal whether the economy is getting better or worse. The index remains well below the levels associated with a healthy economy, however. A confidence gauge that looks ahead six months rose to 73 in March from a six-month low of 70.4. Constant readings below 80, however, often signal a recession within the next year, the board said.
Pending Home Sales Up: Contract signings on homes in the U.S. rose for the third month in a row, as home buyers adjust to high mortgage rates. U.S. pending-home sales rose 0.8% in February, according to the monthly index released last Wednesday by the National Association of Realtors (NAR). Pending home sales rose by a smaller magnitude than the previous month’s increase of 8.1%. The figures beat Wall Street’s expectations. Economists polled by the Wall Street Journal were expecting pending home sales to fall by 3%. Pending home sales reflect transactions where the contract has been signed for an existing-home sale, but the sale has not yet closed. Compared to a year earlier, transactions were down by 21.1%.
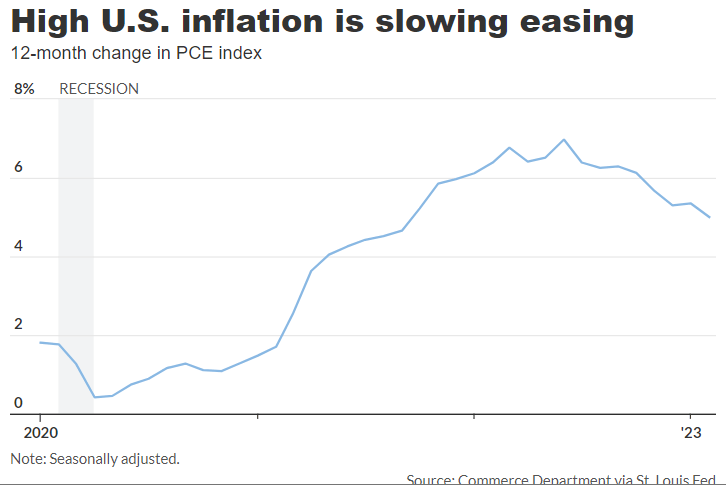
Sign of Slowing Inflation: The cost of U.S. goods and services rose by a milder 0.3% in February, perhaps a sign the Federal Reserve’s fight against high inflation is showing grudging progress. Prices had risen by a sharp 0.6% in January, based on the so-called PCE index. The yearly increase in prices declined to 5% from 5.3% in the prior month, the government said last Friday, marking the lowest level in more than a year and a half. That’s still about three times the rate of inflation before the pandemic, however. The more closely followed core index also increased 0.3% last month, matching Wall Street’s forecast. The core rate of inflation in the past 12 months slipped to 4.6% from 4.7%. The PCE is viewed by the Fed as the best predictor of future inflation trends. It is formally known as the personal consumption expenditures price index. The Fed is trying to straddle a fine line: Bring inflation back down to its 2% target, but without causing a severe economic reaction.
WEAK INDICATORS
Jobless Claims Up: Today’s report showed the number of Americans applying for jobless benefits has topped 200,000 for nine weeks in a row and looks worse than previously reported, based on a change in how the government adjusts for seasonal swings in employment. The newly revised data suggest the labor market has softened more than it had appeared. In the seven days ending April 1, new jobless claims totaled 228,000. That’s down from a revised 246,000 in the prior week. However, two weeks ago, the government had estimated just 198,000 new claims for that week. Governments revisions show that jobless claims bottomed out last fall at a 53-year low of 182,000 and remained around 200,000 until February, when they began to creep higher. Wall Street watches jobless benefits closely because it’s one of the first indicators to emit warning signs when the U.S. is headed toward recession.
GDP Revised Lower: The growth rate of the U.S. economy at the end of 2022 was reduced to 2.6%, last Thursday, due to weaker consumer spending while corporate profits posted the biggest decline in two years. Initially the government said gross domestic product has increased at a 2.9% annual pace. The estimate was reduced to 2.7% last month and now it’s been lowered once again. GDP is the official scorecard of the economy. The U.S. could show a similar growth rate in the first three months of 2023, Wall Street forecasts show. The increase in consumer spending was reduced in the latest estimate to 1% from 1.4% last month and an original 2.1%.
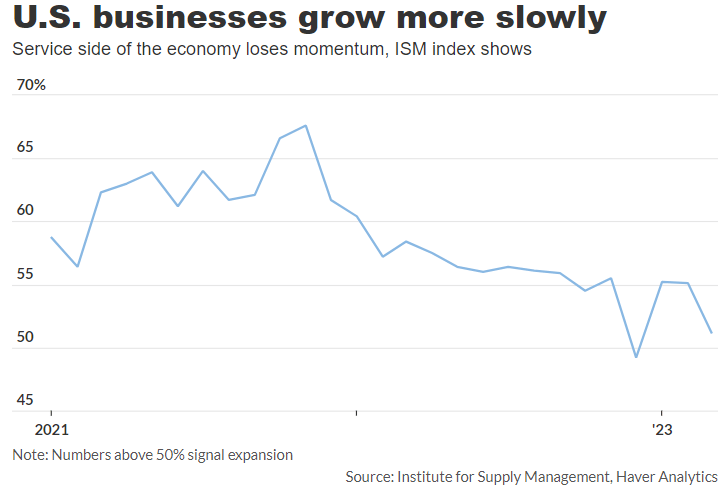
Service Sector Index Down: A bellwether of business conditions at U.S. companies fell to a three-month low of 51.2% in March and signaled slackening growth as strains mount on the economy. The Institute for Supply Management’s services index fell from 55.1% in February according to yesterday’s report. Economists polled by The Wall Street Journal had expected the services index to drop to 54.3%. Numbers above 50% indicate companies are expanding, but the latest survey suggests growth has taken a turn for the worse. Service companies such as banks, hotels, retailers and restaurants make up the bulk of all U.S. businesses. They also employ the vast majority of Americans.
Manufacturing Sector Index Down: A key barometer of U.S. factories was negative in March for the fifth month in a row, reflecting an ongoing struggle by a key part of the economy to resume growth. Monday’s Institute for Supply Management’s manufacturing survey dropped to 46.3% from 47.7% in the prior month. That’s the lowest level since May 2020, when the pandemic show down much of the U.S. economy. Economists polled by the Wall Street Journal had forecast the index at 47.3%. Numbers below 50% signal that the manufacturing sector is contracting. The last time the index fell five months in a row was in 2019, during a trade fight with China.
Factory Orders Down: Orders for manufactured goods fell 0.7% in February, the Commerce Department said Tuesday. That’s the third decline in the past four months. Economists surveyed by the Wall Street Journal were expecting a 0.6% fall. Factory orders fell 2.1% in January. The decline in overall factory orders in February was led by transportation equipment. Excluding transportation, orders were down 0.3%. Orders for nondurable goods fell 0.4% in the month.
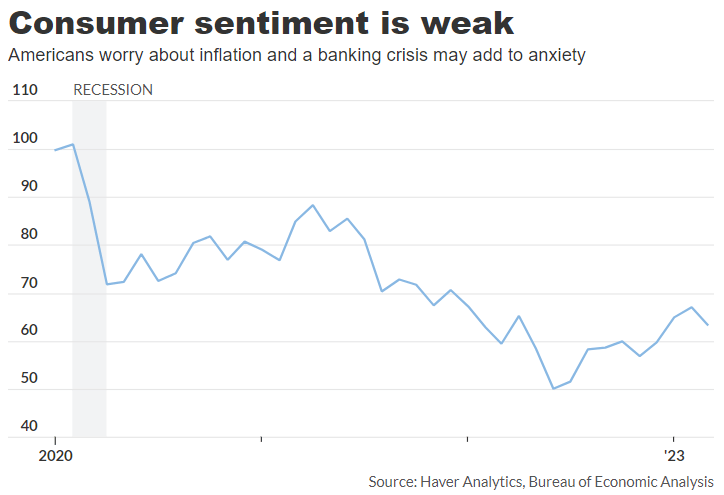
Consumer Sentiment Dropped: A survey of consumer sentiment fell to a four-month low of 62 in March on growing worries about a recession. The final reading in March was down from an original 63.4, the University of Michigan said last Friday. The index registered 67 in February. Consumer sentiment helps gauge how Americans feel about their own finances as well as the broader economy. A gauge that measures what consumers think about the current state of the economy dropped to 66.3 in March from 70.7in the prior month. More notably, a measure that asks about expectations for the next six months declined to 59.2 from a preliminary 61.5 and 64.7 in February. Inflation expectations tapered off again. Consumers expect prices to increase 3.6% in the next year, down from 4.1% in the prior month. That’s the lowest reading since April 2021. Consumer sentiment is far below levels associated with a healthy economy, reflecting persistent worries about a recession.
An easy way to get my ERPE Excerpts is by “text-to-subscribe”. By simply texting to the number 22828 and entering the word erpe excerpts, a prompt is sent to enter an email address and done! You will then receive my bi-monthly market and economic updates. Please pass this on.
Call me if you have any questions. I am always happy to help!
John J. Gardner, CFP®, CPM®.
Blackhawk Wealth Advisors, Inc.
4125 Blackhawk Plaza Circle, Ste. 260 Danville, CA. 94506
Phone: 888-985-PLAN ·
Email: jg@blackhawkwealthadvisors.com
BLACKHAWKWEALTHADVISORS.COM
For my Market Monthly podcast, click on the link below. I provide a review of global stock market highlights over the past month and preview of the month ahead. Forward insights and perspectives are based on current financial market and economic trends with an emphasis on relevant developments in various areas from Fed policy to company earnings announcements.

