ERPE EXCERPTS
Bi-MONTHLY MARKET ANALYSIS &
ECONOMIC UPDATES
April 20, 2023
Warren’s Wisdom…
“A peek behind the curtain.”
In the Chairman’s Letter to the Shareholders from Mr. Warren Buffett, dated February 25, 2023, Mr. Buffett offered “a peek behind the curtain.” While reading the letter to shareholders in the recently issued Berkshire Hathaway, Inc. 2022 annual report, I was again inspired by the wisdom of Warren. Mr. Buffett’s annual letter is one of my favorite reads. Here’s my ERPE Excepts from March 30, 2017 when I wrote about Warren’s letter then.
At 92 years old (young) and with 58 years managing Berkshire, Warren Buffett has certainly gained tremendous investing wisdom. When talking about what he and his partner, Charlie Munger (now 99) do, Buffett reiterated the two forms of investing they conduct in this year’s annual report. He noted they invest in both businesses they control through 100% ownership (direct investments), and invest “passively” through buying publicly-traded stocks. Buffett writes that he and Charlie they are both business owners and business pickers; “not stock pickers”. Coca-Cola, for example, is what Warren and Charlie call “a meaningful sum at Berkshire”. Mr. Buffett highlighted a few stocks he owns for Berkshire in his letter, including Coke, Chevron and Apple. What wowed me about his comments on Coke was that the dividend his holding paid in 1994 was $75 million. Last year the Coke holding dividend was $704 million (no additional shares were bought since 1994). When referring to his and Charlie’s long lives, he attributes it to eating See’s candy – a company they own.
The message from Mr. Buffett that I relayed in my March 30, 2017 Excerpts was primarily about his sentiment about America. His message about our country was uplifting. He noted specific business, market and economic creations and achievements America has accomplished. Mr. Buffett referred to our country’s gains since 1776. He summed his patriotic view on America in one word: miraculous. This year’s message was more about about what he and Charlie do, who they do it for, how they do it and a look back at his 80 years as an investor. A peek behind the curtain.
In closing this year’s letter, Warren Buffett wrote a lot about his partner, Charlie. Under the heading, “Nothing Beats Having a Great Partner”, Warren noted a long list what he has learned from Charlie. Here’s one: “You have to keep learning if you want to become a great investor. When the world changes, you must change.”
Warren’s wisdom this year came with words of wisdom from Charlie, too.
TAKING PERSPECTIVE…
Proper Perspective: In our hectic and often hard to comprehend world, it is very easy to lose perspective. You may agree it is sometimes difficult to see the big picture. The media often doesn’t help with this, but unfortunately instead encourages us to see things in a most negative light. Here is hopefully a pause to gain positive perspective.

Famous Quote On This Day: “I hate race discrimination most intensely and in all its manifestations.”
~ ~ Nelson Mandela, 1962
What Happened On This Day, April 20, – 1971 – US Supreme Court upholds use of busing to achieve racial desegregation.
MARKET ANALYSIS
INDICATORS OF INTEREST:
- Market’s Current Signal: Market in Confirmed Uptrend. Analysis of the stock market over 130 years of history shows we can view it in terms of three stages – market in uptrend, uptrend under pressure and market correction. I analogize this to a traffic signal’s changing colors from green to yellow and then to red. Since the 1880’s, this perspective has led to investment out-performance relative to market indexes. This is due to trend analysis which determines risk reducing, return enhancing market entry and exit points. The U.S. stock market’s current signal is Market in Confirmed Uptrend.

The Stock Market Trend: Market in Confirmed Uptrend. After the regional banking crisis in mid-March, the general market weakened to Market in Correction March 15. In a resilient rally, the trend turned bullish with a signal change to Market in Confirmed Uptrend on March 29.
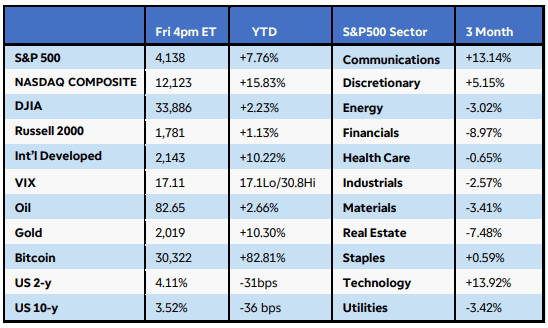
Here are key market levels as of Monday, April 17:
Recapping Last Week
Investors felt some relief as consumer prices eased further in March, but U.S. equity gains were muted by an uptick in future inflation expectations and the probability of at least one more interest rate hike. The Russell 2000 Index rose 1.5%, while the S&P500 edged higher by 0.80% and the Nasdaq Composite was fractionally positive. Seven of 11 S&P500 sectors finished positive, led by a 2.8% jump in financials as some larger U.S. banks reported strong profits despite the recent crisis. Crude oil rose for a fourth straight week after the IEA said it expects global demand to rise to record highs this year, while gold prices slumped Friday after briefly reaching a new 52-week high the prior day. Cryptocurrencies continued their ascent with Bitcoin and Ethereum soaring 8% and 11%, respectively.
Current View
Earnings season heats up in earnest for U.S. corporations this week, while the international agenda focuses on China’s potential growth rebound and global business surveys. Monday night, China reported 1.2% growth from the prior quarter, while retail sales jumped significantly given the lifting of Covid-19 restrictions. Global flash PMIs arrive Friday and investors will be keying in on whether price pressures are receding and to what extent recessionary clues emerge. Wednesday’s UK March CPI is expected to remain stubbornly high, which could all but cement another interest rate hike at the May central bank meeting. The domestic schedule includes regional manufacturing surveys from New York and Philadelphia, housing starts, and existing home sales. First quarter earnings updates are due from Netflix, Tesla, Goldman Sachs, Zions Bancorp, and American Express, among others. Lastly, Canada’s inflation numbers and Eurozone sentiment reports round out the week’s economic calendar.
- Industry Group Strength: BEARISH. As of yesterday, 77 out the 197 groups I monitor are up year-to-date. 120 are down.
- New Highs vs. New Lows: BEARISH. In yesterday’s session, there were 44 new 52-week highs and 103 new 52-week lows.
- Dow Dividend Yield: BEARISH. The current yield for the Dow Jones Industrial Average is 2.21%. The 10-year Treasury now 3.54%.
- Volatility Index: BULLISH. Volatility has been volatile. The “VIX” is now 16.5, down from 18.7 two weeks ago. The index is also known as the “Fear Index.” It is considered a contrarian indicator and therefore viewed as bullish as it rises indicating investors are becoming more fearful. The VIX:

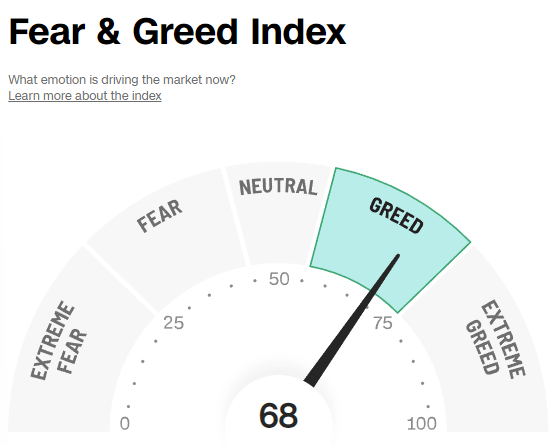
- Fear / Greed Index: NEUTRAL. Investors are driven by two emotions: fear and greed. Too much fear can create a condition of oversold/ undervalued stock prices. Too much greed can result in overbought/overvalued stock prices. The AAII Investor Sentiment Index is now neutral. BE FEARFUL WHEN OTHERS ARE GREEDY. At 68, the Fear & Greed Index is up from 55 two weeks ago.
- Bull / Bear Barometer: NEUTRAL. This secondary market indicator should also be viewed with a contrarian perspective. As of yesterday, according to the latest survey of stock market newsletter writers by Investor’s Intelligence, bullish sentiment is 48.6% and the bears came in at 25%. The bullish read is up from 2-weeks ago when it was about 39.7%. The bearish read is also up from 28.8% 2 weeks ago. Consider this a contrarian indicator because the crowd is often wrong at market tops and bottoms. In other words, extreme bullishness has been seen near several market tops in the past, while extreme bearishness has been seen at market bottoms.
- Put / Call Ratio: BEARISH. The ratio of put-to-call options is .70, down from .88 two weeks ago. The put-call ratio tracks the mood of what options investors are doing, not just saying. They typically buy puts if they think a stock will decline and calls if they think it will rise. If they’re buying lots of puts, they see the market declining. And if they’re loading up on calls, they’re generally bullish. Historically, market bottoms occurred when the reading spikes to 1.2 or more. Market tops are often made when the reading is 0.6 or less. Note how reliable this is with respect to the February record low coinciding with the market high. Keep in mind this is also a contrarian indicator.

ECONOMIC UPDATES
Global Economic Indicators & Analysis:
POSITIVE INDICATORS
Empire State Index Up: The New York Fed’s Empire State business conditions index, a gauge of manufacturing activity in the state, jumped 35.4 points in April to 10.8, the regional Fed bank said Monday. Economists had expected a reading of negative 15, according to a survey by the Wall Street Journal. Any reading above zero indicates improving conditions. This is the first reading in positive territory in five months. The index for new orders soared 46.8 points to 25.1 in April and the shipments index jumped 37.3 points to 23.9.
WEAK INDICATORS
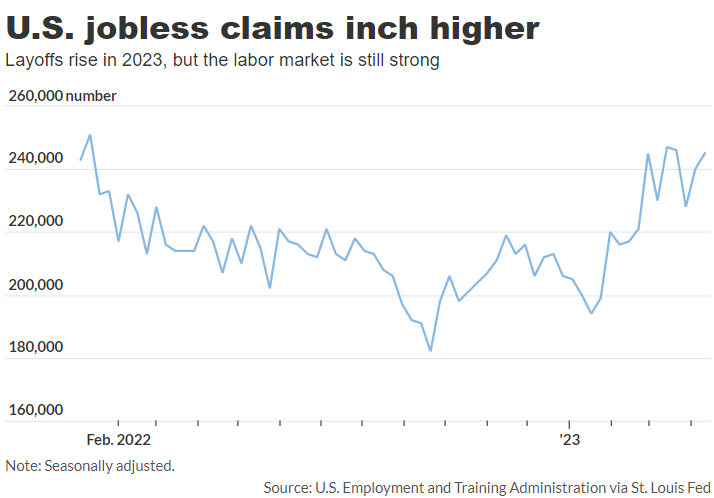
Jobless Claims Up: The number of Americans who applied for unemployment benefits last week rose by 5,000 to 245,000, pointing to a small erosion in the robust U.S. labor market. New jobless claims increased from a revised 240,000 in the prior week, the Labor Department said today. The figures are seasonally adjusted. The number of people applying for unemployment benefits is one of the best barometers of whether the economy is getting better or worse. New jobless claims are still very low, but they have risen from fewer than 200,000 in January in a sign the labor market has cooled slightly as higher interest rates dampen U.S. growth.
LEI Down: The U.S. leading economic index sank 1.2% in March and fell for the 12th month in a row, the Conference Board said today. This continues to signal a recession later in 2023. The decline was the biggest in three years. Economists polled by the Wall Street Journal had forecast a 0.7% drop. The leading economic index, also known as the LEI, is a gauge of 10 indicators designed to show whether the economy is getting better or worse. The report is published by the nonprofit Conference Board. Seven of the 10 indicators tracked by the Conference Board fell in February.
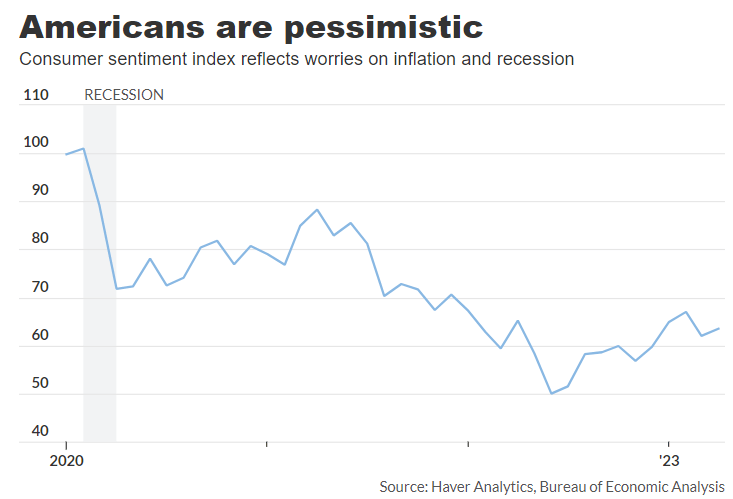
Consumer Sentiment Weakening: A survey of consumer sentiment rose slightly to 63.5 in April and rebounded from a four-month low, but Americans showed more anxiety about high inflation. The index, produced by the University of Michigan last Friday, rose from 62 in March. The consumer sentiment reveals how Americans feel about their own finances as well as the broader economy. The public has been broadly pessimistic since last summer, largely due to high inflation. The index had fallen to a record low of 50 last summer before partly rebounding. Sentiment remains well below a recent peak of 88.3 in 2021 and a pre-pandemic high of 101. A gauge that measures what consumers think about the current state of the economy climbed to 68.6 from 66.3 in March.
Beige Book Shows signs of Slowing Econ: The Fed’s regular survey of the economy, known as the Beige Book, signaled the recent turmoil in the banking system had little immediate effect. U.S. growth more broadly was “little changed” in the six weeks leading up to April 10. The Fed said several regions of the country reported “a slower pace of [employment] growth than in recent Beige Book reports.” Others also said demand for labor slacked off. Yesterday’s Beige Book is consistent with a slowing in growth as the U.S. economy continues to respond to Federal Reserve tightening.
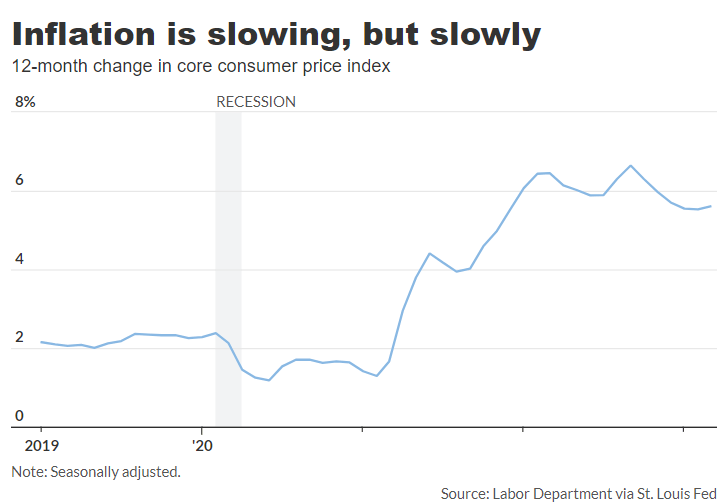
CPI Slowing: Consumer prices (CPI) rose a scant 0.1% in March largely because of lower energy costs, but U.S. inflation more broadly was still high and showed little sign of quickly subsiding. Economists polled by the Wall Street Journal had forecast a 0.2% increase in the CPI. Last Wednesday’s CPI report was the smallest uptick in three months. The yearly rate of inflation slowed to 5% from 6% and and touched the lowest level since May 2021. What’s helped have been extremely high inflation readings in early 2022 dropping out of the yearly rate. More negatively, the so-called core rate of inflation that omits food and energy rose a sharper 0.4%. Wall Street had forecast a 0.4% gain. The increase in the core rate over the past 12 months moved up to 5.6% from 5.5%. These prices have fallen more slowly than the broader CPI and point to inflation remaining stubbornly high through most of the year. In a good sign, the cost of groceries fell for the first time since September 2020. Egg prices sank again, down almost 11%, as a huge increase in costs late last year tied to the bird flu continued to unwind.
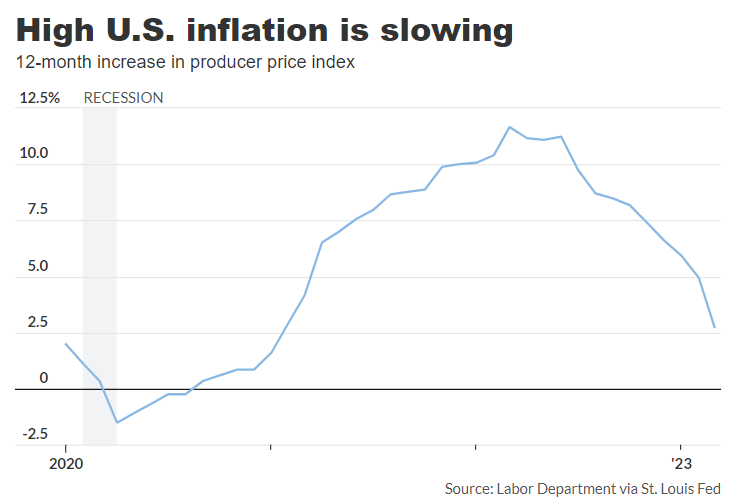
PPI Fell: U.S. wholesale prices (PPI) sank 0.5% in March to mark the biggest decline in almost three years, potentially a sign of further easing in inflation in the months ahead. Economists polled by the Wall Street Journal had forecast no change in the PPI. The drop last month was the biggest since the start of the pandemic in early 2020. Wholesale costs often herald future inflation trends. The increase in wholesale prices over the past 12 months also slowed again to 2.7%, from 4.9% in the prior month. That’s the lowest reading since January 2021. A separate measure of wholesale prices that strips out volatile food and energy costs as well as trade margins rose a scant 0.1% last month, the government said last Thursday. That was also below Wall Street’s forecast. The increase in these so-called core prices over the past year eased to 3.6% from 4.5%.
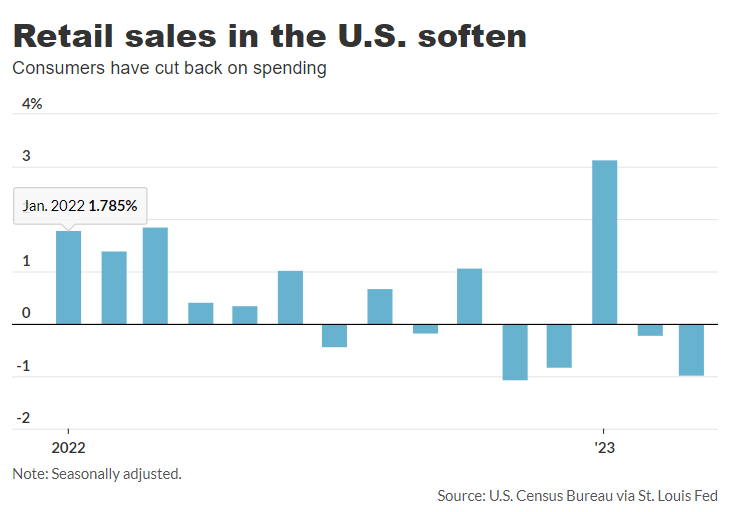
Retail Sales Down: Last Friday’s retail sales report showed sales at retailers dropped 1% in March and declined for the fourth time in the past five months, reflecting a slowdown in the U.S. economy and a shift in consumer-spending habits. Retail sales are a big part of consumer spending and offer clues about the strength of the economy. Sales had been forecast to drop 0.4%, based on a Wall Street Journal poll of economists. Sales in March posted the biggest decline in four months, largely because of lower auto and gasoline sales. A late Easter holiday might have also shifted some sales into April that normally would have taken place in March, economists say.
New Home Construction & Permits Down: Construction of new homes fell 0.8% in March to a rate of 1.42 million due to slower work on apartment buildings, leaving prospective buyers with limited options. Economists polled by the Wall Street Journal had forecast a 1.4 million rate of new housing starts. That’s the number of homes that would be built over an entire year if construction took place at the same rate in every month as it did in March. Offsetting the decline in apartment projects, construction of single-family homes rose 2.7%. Building permits, a key indicator of the pace of future construction, fell a sharper 8.8% to a 1.41 million rate, the government said Tuesday.
NFIB Down: The National Federation of Independent Business (NFIB) said last Tuesday that its small-business optimism index decreased to 90.1 in March from 90.9 in February, well below the index long-term average and erasing the slight gains in confidence registered in the first two months of the year. Still, the reading is above the 89.0 consensus forecast from economists polled by The Wall Street Journal. The NFIB survey provides a monthly snapshot of small businesses in the U.S., which account for nearly half of private sector jobs. The decline in confidence was driven by a worsening assessment of the short-term outlook, data from the survey showed.
An easy way to get my ERPE Excerpts is by “text-to-subscribe”. By simply texting to the number 22828 and entering the word erpe excerpts, a prompt is sent to enter an email address and done! You will then receive my bi-monthly market and economic updates. Please pass this on.
Call me if you have any questions. I am always happy to help!
John J. Gardner, CFP®, CPM®.
Blackhawk Wealth Advisors, Inc.
4125 Blackhawk Plaza Circle, Ste. 260 Danville, CA. 94506
Phone: 888-985-PLAN ·
Email: jg@blackhawkwealthadvisors.com
BLACKHAWKWEALTHADVISORS.COM
For my Market Monthly podcast, click on the link below. I provide a review of global stock market highlights over the past month and preview of the month ahead. Forward insights and perspectives are based on current financial market and economic trends with an emphasis on relevant developments in various areas from Fed policy to company earnings announcements.


