ERPE Excerpts 8.1.2024 Wall Street’s “Great Rotation”

dc6d6594-dfce-48b0-8d69-3a27db12748d image

Presents our

Bi-Monthly

 ERPE Excerpts

John J. Gardner, CFP®, CPM®

blackhawkwealthadvisors.com

Bi-MONTHLY MARKET ANALYSIS &

ECONOMIC UPDATES

August 1, 2024

Wall Street’s “Great Rotation”

The U.S. stock market is in the midst of an exceptional rotation. There is no doubt about that as is has been historical. July is now being referred to month of the stock market’s “Great Rotation”. The question is, Will the “Great Rotation’” continue? Here is perspective on the recent market move and some insight on the trend’s direction going forward.

In recent weeks, the U.S. stock market has exhibited notable movements that align with the ongoing “Great Rotation.” Here are some key developments:

Sector Performance Shifts:

Value sectors such as financials, energy, and industrials have seen increased investment and improved performance. These sectors generally benefit from higher interest rates and a stronger economic outlook. Conversely, growth stocks, particularly in the technology sector, have faced volatility and declines. In a sharp equity asset class shift, small cap value stocks have jumped meaningfully higher while large cap growth stocks, specifically the mega cap tech stocks, is in a near correction mode. Perhaps nothing could display this rotational move better than the chart below. It shows the dramatic outperformance of the small cap value index (Russell 2000) compared to the 100 largest growth stocks (Nasdaq 100 index).

Wow. Small-cap index gained nearly 10% in 3-weeks while the large-cap index lost over 6%. That kind of rotation from large growth to small value has not happened since early 2000 when the “dotcom” stock market bubble popped.

Interest Rates and Inflation:

The market’s expectations of an interest rate cut and less-than-positive earnings reports from some of the “Mag 7” stocks are the catalysts for the recent rotation. The Federal Reserve’s comments, especially yesterday, of potential interest rate cuts has continued to influence investor behavior. Economic indicators indicating signs of cooling inflation have reinforced expectations for a rate cut as soon as September.

Economic Data:

Recent economic data reports showing strong employment figures and consumer spending have boosted confidence in cyclical sectors over high-growth tech stocks. These reports suggest that the economy is progressing towards recovery, making value stocks more attractive. This is a positive development for the general stock market’s overall health as an increase in industry and sector participants broadens.

Capital Flows:

There has been a noticeable increase in capital flows into exchange-traded funds (ETFs) and mutual funds concentrating on value-oriented investments, indicating a broader market trend towards these sectors.

The Great Debate about the Great Rotation:

Many on Wall Street expect this rotation from big-cap growth to small-cap stocks and lagging sectors of the market to continue. However, some remain cautious as to whether the “Great Rotation” trade will see its current momentum sustain its strength. The U.S. stock market closed out a bumpy July marked by election turmoil, interest-rate uncertainty and disappointing earnings that took mega-cap technology names on a roller-coaster ride. If history is any guide, the so-called Magnificent Seven could stage a comeback as the calendar turns to August. Historically, August has been the best month for the Nasdaq index during election years since 1971. In that time the Nasdaq has gained an average 3.2% return in August. Better yet, during election years August has also been a great month for small-cap stocks. Since 1979, the small-cap Russell 2000 index has seen an average 3.5% monthly return in August. So, if history repeats, small cap stock gains would outpace large caps this month. Obviously, both historic return averages would welcomed. Perhaps the biggest winner of the debate over the sustainability of small over large stock performance will be earnings announcements. Today both Apple and Amazon report their quarterly results and will provide the all-important future business guidance. Another mega-cap company, and trillion dollar club member, Nvidia, reports August 28. My take on the rotation’s fate between now and year end is in the hands of investor sentiment. If the investor’s confidence remains high in AI big tech will resume market leadership. Valuations and potential interest rate cuts, though favor small cap stocks. The market may get both. Then expect to hear, “It’s a Goldilocks market”.

TAKING PERSPECTIVE

Proper Perspective:  In our hectic and often hard to comprehend world, it is very easy to lose perspective. You may agree it is sometimes difficult to see the big picture. The media often doesn’t help with this, but unfortunately instead encourages us to see things in a most negative light. Here is hopefully a pause to gain positive perspective.

Famous Quote For Today:

“First gain the victory and then make the best use of it you can.”

~ ~ Horatio Nelson, 1797

What Happened On This Day August 1, 1876 – Just 28 days after the U.S. celebrated its 100th birthday, Colorado, the “Centennial State” became the 38th to join it.

MARKET ANALYSIS

INDICATORS OF INTEREST:

  • Market’s Current Signal: Market Uptrend Under Pressure.  Analysis of the stock market over 130 years of history shows we can view it in terms of three stages – market in uptrend, uptrend under pressure and market correction. I analogize this to a traffic signal’s changing colors from green to yellow and then to red. It is still green. Since the 1880’s, this perspective has led to investment out-performance relative to market indexes. This is due to trend analysis which determines risk reducing, return enhancing market entry and exit points.

The Stock Market Trend: Uptrend Under Pressure. From November 1 to last week the market was in a Confirmed Uptrend. Market action on April 12 triggered the weakened trend signal to Uptrend Under Pressure. After running higher 18 out of 22 weeks, the SP 500 fell 3 consecutive weeks. May 16 market action changed that again, triggering a positive trend change back to Confirmed Uptrend. That bullish trend weakened July 24. Then the market’s trend signal lowered to Uptrend Under Pressure.

Here are key market levels as of Monday, July 29.

Recapping Last Week

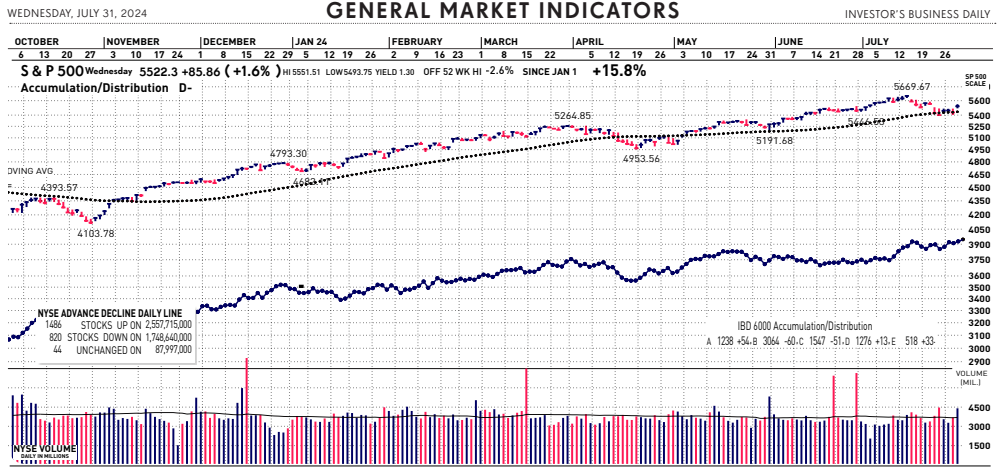
U.S. equity indices once again posted mixed performance in volatile trading as investors assessed the latest economic data and corporate earnings results. The Nasdaq Composite index fell more than 2%, while the S&P500 edged lower by nearly 1%. The Russell 2000, on the other hand, notchedits third straight week of gains, jumping 3.5%. S&P500 sector performance was spilt, with technology, communications, and consumer discretionary underperforming significantly. Disappointing earnings reports from Alphabet and Tesla sent the Nasdaq-100 index tumbling by more than 3.5% on Wednesday. Crude oil prices fell 2.3% as traders feared falling demand from China. U.S. Treasury yields retreated on Friday after June’s PCE index readings were in line with expectations, keeping on track a widely anticipated September interest rate cut. The headline inflation number was up 0.1% MoM and 2.5% YoY, while core PCE increased 0.2% MoM and 2.6% YoY. Personal income was below forecasts, with spending matching estimates. Data earlier in the week revealed that economic activity continued to surprise to the upside with inflation subsiding, which is music to the Federal Reserve’s ears. Second-quarter GDP grew at a 2.8% annualized rate, well above expectations and led by a 2.3% increase in consumer spending. The economic momentum extended into July, as the S&P Global flash composite PMI rose to 55 and the services sector reached a 28-month high of 56.0. Goods and services prices continued to increase MoM, but at a slower rate. Durable goods orders for June were up 0.5%, excluding the volatile transportation sector. However, U.S. housing remained mixed as sales fell and prices rose. New and existing home sales sliding in June. The median existing home price jumped 4.1% YoY to an all-time high of $426,900.

Internationally, China surprised markets twice last week with interest rate adjustments. First, the country cut benchmark lending rates for the first time in nearly a year as leadership faces potential deflation, surging debt, and trade tensions. Second, China’s central bank conducted an unscheduled lending operation at sharply lower rates to provide more monetary stimulus. Chinese stocks fell as investors feared the urgent action indicated the economy could be in worse shape than previously thought. Elsewhere, the Bank of Canada lowered interest rates for a second straight meeting, with officials signaling that downside economic risks may be building. Finally, flash PMI readings in Europe and the UK reflected diverging economic trends. Germany’s manufacturing activity plunged to new lows, while Britain’s saw the fastest growth in two years.

Current View

The major market indexes closed out July on a strong note yesterday. Driven mainly by rate cut expectations and Fed chair Powell’s perceived support for that, a broad, bullish rally nearly boosted the Nasdaq higher for the month. It was just fractionally lower for July. The dominant winner in July was the Russell 2000 index, underscoring the “Great Rotation”. Today, though, the indices reversed sharply lower and small caps got whacked on some disappointing news on the U.S. economy. The Russell 2000 led the sell-off in equities, falling over 3% by mid-morning trading.

  • Industry Group Strength:  BULLISH. As of yesterday, 127 out the 197 groups I monitor are up year-to-date. 70 are down.
  • New Highs vs. New Lows: BULLISH. As of now, there were 391 new 52-week highs and 77 new 52-week lows.
  • Dow Dividend Yield:  BEARISH. The current yield for the Dow Jones Industrial Average is 1.94%. The 10-year Treasury now 3.98%. This is the first time the 10-year Treasury yield has dipped below 4% since February.
  • Volatility Index:  NEUTRAL. Volatility has been volatile. The “VIX” is near 19. It is up from 16 two weeks ago. The index is also known as the “Fear Index.” It is considered a contrarian indicator and therefore viewed as bullish as it rises indicating investors are becoming more fearful. The VIX:
502fdd07-23bc-47a7-ad04-cc3b3f2387db image
  • Fear / Greed Index: BULLISH.  Investors are driven by two emotions: fear and greed. Too much fear can create a condition of oversold/ undervalued stock prices. Too much greed can result in overbought/overvalued stock prices. The AAII Investor Sentiment Index is now neutral.   BE FEARFUL WHEN OTHERS ARE GREEDY. At 42, the Fear & Greed Index is down from 51 two weeks ago.

CLICK VIDEO FOR MORE ON THE “FEAR & GREED INDEX”

How CNNMoney’s Fear & Greed Index works

  • Bull / Bear Barometer:  BEARISH. This secondary market indicator should also be viewed with a contrarian perspective. As of yesterday, according to the latest survey of stock market newsletter writers by Investor’s Intelligence (see below), bullish sentiment is 59.4%. The bear sentiment is now 15.6%. This reflects a decrease in bullish and bearish sentiment over the last two weeks. Consider this a contrarian indicator because the crowd is often wrong at market tops and bottoms. In other words, extreme bullishness has been seen near several market tops in the past, while extreme bearishness has been seen at market bottoms.  Note how close market sentiment is near the 5-year bullish high and near the 5-year bearish low…
  • Put / Call Ratio: BEARISH. The ratio of put-to-call options is 0.46.  It is up from 0.34 two weeks ago. The put-call ratio tracks the mood of what options investors are doing, not just saying. They typically buy puts if they think a stock will decline and calls if they think it will rise. If they’re buying lots of puts, they see the market declining. And if they’re loading up on calls, they’re generally bullish. Historically, market bottoms occurred when the reading spikes to 1.2 or more. Market tops are often made when the reading is 0.6 or less. Note how reliable this is with respect to the February record low coinciding with the market high. Keep in mind this is also a contrarian indicator.

ECONOMIC UPDATES

Global Economic Indicators & Analysis:

POSITIVE INDICATORS

S&P Flash Surveys Show Growth: The U.S. economy grew faster in July, a pair of S&P surveys found, in a sign it is holding up well despite high interest rates and lingering inflation. The big new worry is a turbulent presidential election. The U.S. economy grew faster in July, a pair of S&P surveys found, in a sign it is holding up well despite high interest rates and lingering inflation. The big new worry is a turbulent presidential election. The preliminary U.S. manufacturing PMI, however, fell to a six-month low of 49.5 and dipped back into negative territory. Manufacturers are still important, but they are a much smaller part of the economy these days. Purchasing managers buy supplies for their companies. They buy more when times are good and less when the economy sours. The surveys are the first indicators each month of how well the U.S. economy is doing. New orders, a sign of future sales, rose in July, but most of the increase was among service-oriented companies. Manufacturers showed a decline in new orders. Employment levels were muted, suggesting that fewer companies overall are hiring. Prices rose at one of the slowest rates in four years because of stiffer competition for customers, S&P said, in a sign inflation is waning. At the same time, however, higher labor costs and prices of raw materials indicated inflation might not soon return to low prepandemic levels. The economy has slowed since a spurt of surprisingly fast growth in the second half of last year, but it still appears to be fairly strong.

U.S. Productivity Rebounds Sharply: U.S. productivity accelerated to a 2.3% annual clip in the second quarter, up from a revised 0.4% gain in the prior three-month period, the government said this morning. Over the past four quarters, U.S. productivity has increased at a 2.7% pace. That’s down from a 2.9% rate in the first quarter. Unit-labor costs, a key measure of wages, rose 0.9% in the second quarter, down from a 3.8% rate in the prior quarter. Over the past year, unit labor costs are up 0.5%. Economists were expecting a bounce in productivity given the stronger-than-expected 2.8% GDP growth rate in the second quarter. Productivity has been a lot better over the past year, but economists are cautious about whether this is sustainable. Higher productivity means that companies don’t have to pass wage gains to consumers in the form of higher prices.

Feds Keep Rates Steady, Powell Dovish: The decision by the 12 Fed voting members to leave interest rates unchanged was unanimous. Federal Reserve chief Jerome Powell said a reduction in U.S. interest rates is “on the table” in September if inflation slows further like it has in the past several months. “The question will be whether the totality of the data … are consistent with rising confidence on inflation and maintaining a solid labor market,” Powell told reporters yesterday. “If that test is met, a reduction in our policy rate could be on the table as soon as our next meeting in September. If that test is met, a reduction in our policy rate could be on the table as soon as our next meeting in September”. Powell then said the Fed just wants “a little more confidence” inflation is trending steadily lower before pulling the trigger. The Fed benchmark short-term interest rate now stands at 5.25% to 5.5%. Central bank officials will see two more months of inflation data before they meet again in mid-September. Traders on Wall Street fully expect a first rate cut at that meeting, followed by a succession of additional cuts.

Pending Home Sales Post Surprise Jump: Pending home sales rose in June as an increase in for-sale listings prompted some home buyers to act. Pending home sales rose 4.8% in June from the previous month, according to the monthly index released yesterday by the National Association of Realtors (NAR). Pending home sales reflect transactions where the contract has been signed for an existing-home sale, but the sale has not yet closed. Economists view it as an indicator for the direction of existing-home sales in subsequent months. Transactions were still down 2.6% from a year ago. All figures are seasonally adjusted. While some buyers wait for mortgage rates to drop before acting, an increase in housing inventory is prompting others to snap up homes. An increase in inventory presents more options for home buyers, and also keeps a lid on how much higher home prices go. That’s in the face of prices reaching a new record.

Consumer Confidence Ticks Up: The index of consumer confidence rose to 100.3 in July from a revised 97.8 in the prior month, the Conference Board said Tuesday. Part of the survey that tracks how consumers feel about current economic conditions fell slightly — to 133.6 this month from 135.3 in June. About 16% of consumers said jobs were “hard to get” in July, up from 15.7% in the prior month. That’s the highest level since March 2021. A gauge that assesses what Americans expect over the next six months rose to 78.2, up from 72.8 in the prior month. Consumer confidence has been relatively soft all year and very choppy for the last four months. Economists said this adds to a sense of weaker economic conditions that could set the stage for an interest-rate cut by the Federal Reserve in September. The Conference Board data is stronger than the similar survey of sentiment from the University of Michigan, which hit an eight-month low in July.

S&P Case Shiller Hits Record High: Home prices in the 20 biggest U.S. metros climbed to a new record high in May, but showed signs of losing steam as interest rates remain high. The S&P CoreLogic Case-Shiller 20-city house-price index rose 0.3% in May compared to the previous month. Home prices in the 20 major U.S. metro markets were up 6.8% in the last 12 months ending in May. That’s a deceleration compared to an increase of 7.3% the previous month. A broader measure of home prices, the national index, rose 0.3% in May and was also up 5.9% over the past year. All numbers are seasonally adjusted. All 20 major markets reported yearly gains for the sixth month in a row and the 20-city and the national index are at an all-time high. Though the pace of home-price appreciation slowed in May, they still climbed to another all-time high. High mortgage rates are weighing on home buyers, yet the market is still seeing demand for homes outpace the supply of home listings, which is pushing prices up.

U.S. Q2 GDP Shows Economy Accelerating: Gross domestic product, the official scorecard of the economy, expanded at above-average 2.8% annual pace in the second quarter, the government said last Thursday. GDP grew twice as fast as it did in the first quarter, when the economy expanded at a 1.4% rate. The improvement in GDP was spearheaded by a 2.3% advance in consumer spending, the main engine of the economy. A large increase in inventories, or unsold goods, also padded headline GDP by 0.8% percentage points. The gain from inventories is unlikely to last, however, because customer demand has softened. Not all the details were great. Some key parts of the economy also show more strains that appear likely to persist until the Federal Reserve cuts interest rates. Business spending was soft overall and consumers cut back on services, a huge source of recent economic strength. The rate of inflation, meanwhile, eased in the second quarter after a shocking surge early in the year.

WEAK INDICATORS

ISM Manufacturing Index Continues Slump: A key barometer of U.S. factories fell in July for the fourth consecutive month and hit an eight-month low — a sign that an ongoing slump in the industrial side of the economy has deepened. The Institute for Supply Management’s manufacturing index slid to 46.8% last month from 48.5% in June. Numbers below 50% signal the manufacturing sector is shrinking. ISM reports on manufacturers and service-oriented companies offer a window into the health of the economy. Economists polled by the Wall Street Journal had forecast the index to rise slightly last month. The industrial side of the economy is unlikely to gather steam until the Federal Reserve cuts interest rates. High borrowing costs have sapped the economy and curtailed demand for manufactured goods.

Initial Jobless Claims Jump to One-Year High: The number of Americans who applied for unemployment benefits last week jumped to a nearly one-year high of 249,000, but most of the increase was tied to annual auto-plant shutdowns and Hurricane Beryl. New claims rose by 14,000 in the seven days that ended July 27 from 235,000 in the prior week, the government said this morning. Raw jobless claims — before seasonal adjustments — actually fell last week to 215,827 from 225,839 in the prior week. Hiring has tapered off and wages are rising more slowly in a cooling labor market. Yet layoffs are still low historically and it suggests companies have enough business to retain most of their workers.

Employment Cost Index Shows Softening: The wages and benefits that companies pay their workers rose less than 1% for the second time in the past three quarters, reflecting the waning demand for labor in a slower-growing economy. The employment cost index rose 0.9% in the second quarter. The ECI is viewed as the most accurate measure of U.S. labor costs and can give insight into inflationary trends. After exploding during the pandemic, compensation costs have eased over the past two years. The Fed wants to see costs slow even further. Wages and benefits rose an average of 2.7% a year in the three years prior to the pandemic. The red-hot jobs market of a few years ago is a thing of the past. Fewer companies are hiring and it isn’t as easy to find a job.

ADP Employment Shows Weakness: U.S. businesses added just 122,000 new jobs in July, paycheck company ADP said, in another sign the labor market has cooled off and fewer people are being hired. The increase was the smallest in six months. A softening labor market has also reduced the leverage of employees in winning bigger wage gains. The 12-month increase in pay for people who’ve stayed in the same job fell to a three-year low of 4.8% in July. ADP is not a good predictor of the government’s official jobs estimate that follows a few days later, but the two reports do move in the same direction over time.

Job Openings Dip Again: Job openings in the U.S. dipped again in June and the number of people quitting fell to a nearly four-year low as the labor market continued to cool, paving the way for the Federal Reserve to cut interest rates soon. Job postings dipped to 8.18 million in June from 8.23 million in May. Lots of jobs are still available and plenty of companies are looking for help, but the labor market has clearly cooled off after a torrid burst of hiring once the pandemic faded. Although many openings are never actually filled, the trend in job postings provides clues about the health of the labor market and the broader economy. The number of job openings for each unemployed worker was flat at 1.2, pretty much putting the metric in the Federal Reserve’s sweet spot. The ratio shot up to a record 2.0 when companies were desperate to rehire after the economy reopened.

Consumer Sentiment Hits 8 Month Low: Consumers’ optimism on the U.S. economy remained stuck at an eight-month low in July because of frustration with lingering inflation, especially among lower-income households that feel the financial strain the most. The second and final reading of the consumer sentiment index in July rose slightly to 66.4 from a preliminary 66.0 earlier in the month. But it’s fallen four months in a row and is at its weakest point since last winter. The index also stands well below a pre-pandemic high of 101 from February 2020. Americans think inflation will ease to 2.9% in the next year. The current rate of inflation is 3%, based on the consumer price index. A gauge that measures what consumers think about the current state of the economy totaled 62.7 in July. That’s the lowest level in 19 months. A measurement of expectations for the next six months was somewhat stronger at 68.8. Prices aren’t rising rapidly anymore, but inflation remains a big sore spot with consumers.

PCE Shows Small Increase in U.S. Inflation: Prices in the U.S. rose slightly in June in another confirmation that inflation has slowed again, keeping the Federal Reserve on track to cut high U.S. interest rates in the next few months. The Fed’s preferred PCE index edged up 0.1% last month, the government said last Friday. The June PCE report was not without a minor blemish. The core index is viewed by the Fed and Wall Street as a better predictor of future inflation. The increase in the past 12 months was unchanged at 2.6%. Prices in May were revised higher to show a slightly bigger increase in inflation.

Durable Goods Orders Plummet: Orders for durable goods fell 6.6% in June, the Commerce Department said last Thursday. It is the sharpest drop since the pandemic. It is the first decline in durable goods after four straight gains and was driven by a 20.5% drop in transportation orders. Nondefense orders plummeted 127%. There were signs of strength under the surface. Core capital goods orders, which exclude volatile sectors like transportation and defense, rose 1% last month after a 0.9% fall in May. Business investment is struggling. Year-over-year, durable orders are down 10.3%. That’s the largest drop since June 2020.

New Home Sales Fall: Sales of newly built homes in the U.S. dipped in June as buyers continue to deal with an unaffordable housing market. Buyers are constrained by high home prices and elevated mortgage rates. Sales of new homes are at the lowest level since November 2023. Sales of newly built homes in the U.S. fell 0.6% to an annual rate of 617,000 in June, from a revised 621,000 in the prior month. The number is seasonally adjusted and refers to how many homes would be built over an entire year if builders continued at the same pace every month. Overall, sales of new homes were down 7.4% compared with the previous year. The entire residential real-estate industry, including mortgage brokers, real-estate agents and home builders, are feeling the effects of high mortgage rates and home prices.

Existing Home Sales Down Again: Existing home sales fell for the fourth month in a row in June as record-high home prices and 7% mortgage rates weighed on buyers. Sales of previously owned homes fell 5.4% to an annual rate of 3.89 million in June. That’s the lowest level since December 2023. It is the slowest pace of home sales in any June since 1999, when the NAR began tracking the data. The median price of an existing home in June rose 4.1% as compared with the year before, to $426,900, an all-time high. Unsold inventory rose to the highest level in four years. It’s been a tough summer for the real-estate industry, as buyers pull back on purchases due to record-high home prices and elevated mortgage rates. That’s in spite of the fact that there are more homes on the market today than a year ago. The months ahead could be less gloomy. In July, mortgage rates fell on the back of expectations of an interest-rate cut by the Federal Reserve, which could bring some rate-sensitive buyers back into the market.

Call me if you have any questions. I am always happy to help!

John J. Gardner, CFP®, CPM®, AIF®

Blackhawk Wealth Advisors, Inc.

3860 Blackhawk Rd. Ste. 160 Danville, CA. 94506

Phone: 888-985-PLAN · Email: jg@blackhawkwealthadvisors.com

BLACKHAWKWEALTHADVISORS.COM

For my Market Monthly podcast, click on the link below. I provide a review of global stock market highlights over the past month and preview of the month ahead. Forward insights and perspectives are based on current financial market and economic trends with an emphasis on relevant developments in various areas from Fed policy to company earnings announcements.

Link to Market Monthly Podcast