ERPE Excerpts 7.17.25 Happiness = Wealth

Bi-MONTHLY MARKET ANALYSIS &

ECONOMIC UPDATES

July 17, 2025

Happiness = Wealth

Americans Define Their Wealth by Happiness

We’ve all heard the saying, “Money can’t buy happiness”. In the words of Benjamin Franklin, “Money has never made man happy, nor will it, there is nothing in its nature to produce happiness.” The saying “money can’t buy happiness” is a complex one, with evidence supporting both sides. While money can alleviate financial stress and provide access to experiences that might bring joy, it doesn’t guarantee lasting happiness or replace fundamental needs like strong relationships, purpose, and personal fulfillment. Either way, the topic has attracted a lot of attention in history. Charles Schwab has been conducting the Modern Wealth Survey since 2017. The 2025 survey is the ninth annual issue. This year’s online survey was conducted from April 24, 2025, to May 23, 2025, among a national sample of 2,000 Americans aged 21 to 75. The graph below shows how Americans define wealth.

When asked what makes them feel wealthy, the survey respondents underemphasized the amount of money they had. The majority of those surveyed said they felt wealthy based on quality of relationships, happiness and free time. The graph below shows the results.

Wealth is about more than money?

While Schwab’s 2025 Modern Wealth Survey shows Americans define wealth as more than just money, the survey also found it takes more money for Americans to be financially comfortable than it did a year ago. According to survey responses, Americans believe it takes $839,000 to be “financially comfortable.” This is up from $778,000 reported last year, but down from the $1 million Americans cited in 2023. This year’s Modern Wealth Survey also revealed that Americans now think it takes an average of $2.3 million to be considered “wealthy,” which is a slight drop year over year but is consistent with the five-year trend. Here are the findings…

Apparently age is a factor on what it takes to feel rich. The table below indicates it takes less for today’s younger generation. Maybe the “Boomers” have a more expensive habits…
Here are the generational definitions used by the survey:

• Gen Z: 1997-2003

• Millennials: 1981-1996

• Gen X: 1965-1980

• Boomers: 1948-1964

Some more wisdom on money and happiness…

“The best things in life are free. The second best are very expensive.” — Coco Chanel

“Wealth consists not in having great possessions, but in having few wants.” — Epictetus

“Too many people spend money they haven’t earned, to buy things they don’t want, to impress people they don’t like.” — Will Rogers

For a reasonable reason for why money can’t buy happiness, click into the attached TedTalk below by a Psychology Professor. It’s about 15 minutes, but worth a listen…

Why Money Can’t Buy Happiness

TAKING PERSPECTIVE…

Proper Perspective:  In our hectic and often hard to comprehend world, it is very easy to lose perspective. You may agree it is sometimes difficult to see the big picture. The media often doesn’t help with this, but unfortunately instead encourages us to see things in a most negative light. Here is hopefully a pause to gain positive perspective.

Famous Quote On This Day:  “Here age relives fond memories of the past, and here youth may savor the challenge and promise of the future. (Opening of Disneyland)”

~~Walt Disney, 1955

What Happened On this Day July 17, 1867 –  The first dental school in US was Harvard School of Dental Medicine, in Boston.

MARKET ANALYSIS

INDICATORS OF INTEREST:

  • Market’s Current Signal: Confirmed Uptrend.  Analysis of the stock market over 130 years of history shows we can view it in terms of three stages -market in uptrend, uptrend under pressure and market correction.  Since the 1880’s, this perspective has led to investment out-performance relative to market indexes. This is due to trend analysis which determines risk reducing, return enhancing market entry and exit points. The U.S. stock market’s current signal indicates the market is in Confirmed Uptrend. That officially happened April 22 and is still intact.

The Stock Market Trend: Confirmed Uptrend. The stock market powered higher Tuesday, April 22 and the Nasdaq and S&P 500 confirmed new rally attempts. This follow-through signaled a Confirmed Uptrend. Four weeks ago the major stock market indexes reclaimed levels set in late February and significantly above the pre-“Liberation Day” prices. Now the major indexes are closing in on new all-time record highs.

Here are key market levels as of Monday, July 14

Recapping Last Week

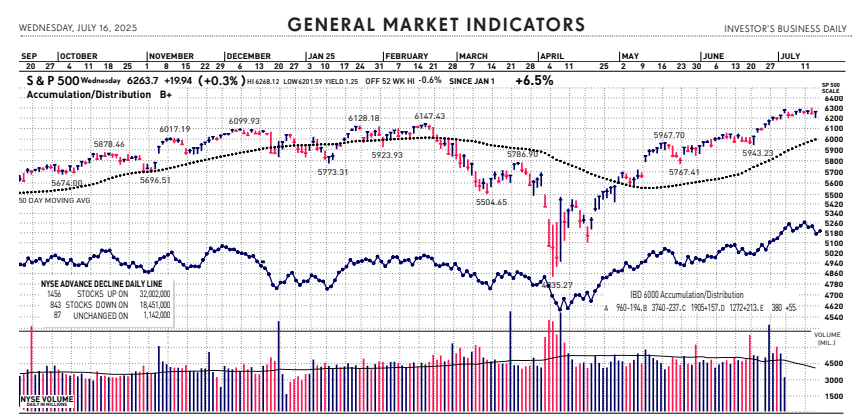
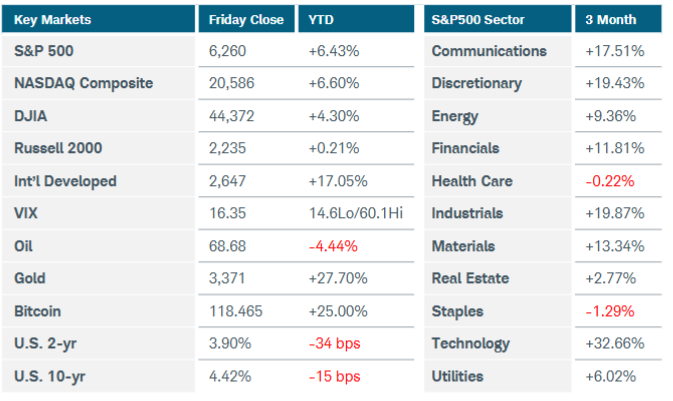
U.S. equity indices wobbled but still stayed near all-time highs despite additional trade war and tariff escalations. The S&P500, Nasdaq Composite, and Russell 2000 indices all finished marginally lower for the week. Six of eleven S&P500 sectors lost ground, including technology which failed to close higher even as Nvidia became the first company to exceed a $4 trillion market capitalization. In the commodity space, copper futures soared nearly 9% after President Trump proposed a 50% tariff on imports of the metal, which is a critical component of military hardware, electric vehicles, and many consumer goods. Gold futures rose more than 1% while silver prices spiked 5.5% to $39.15—their highest level since September 2011. Crude oil gained 2% after OPEC ministers and heads of western oil majors said that recent output boosts are not leading to higher inventories, which suggests an increase in global demand. Bitcoin jumped 7% to fresh record highs above $118,000. Auctions for 10- and 30-year Treasuries were met with solid demand but yields still pushed higher by week’s end. Aggressive tariff talk directed toward Japan, South Korea, Brazil, and Canada heightened inflationary concerns. The U.S. dollar also rose as currency traders speculated that tariffs may not damage the U.S. economy as much as initially feared and that interest rates could remain at or near current levels. Turning to economic data, Americans’ inflation outlook was little changed last month while households grew more optimistic on their finances, according to the New York Fed Survey of Consumer Expectations. Small business confidence slipped slightly in June as firms fretted over excess inventories. Minutes from the most recent FOMC meeting revealed that expectations for how tariffs might impact inflation differed. New rate projections showed that 10 of 19 officials expect at least two rate cuts by year-end, seven members project no cuts, and two members expect only one.

Overseas, Australia’s central bank chose to wait for more confirmation that inflation was easing before cutting rates, surprising market participants. Governor Bullock said the bank remained committed to loosening monetary policy provided that Q2 CPI is in-line with forecasts. China’s producer price index continued to tumble, falling 3.6% YoY in June. Consumer inflation edged slightly higher but domestic demand was still weak, adding pressure on policymakers to provide additional fiscal support. In Europe, the investor confidence index rose 4.4 points this month to reach its highest level since February 2022. Finally, Britain’s economy contracted for a second straight month in May, dashing hopes for Q2 GDP growth and adding to rate cut expectations.

Current View

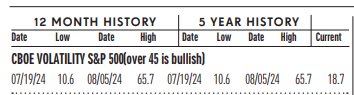
Small caps led another stock market rally Wednesday — and the major stock indexes closed near session highs — as Wall Street weighed another tame reading on inflation. Investors continue to shrug off the trade war drama, with the Volatility index falling to a five-month low of 15.70 last week. While the recent rally in stocks has been tested this week by a slew of economic data and corporate earnings announcements, so far it has passed the test. One day after a mostly in-line reading on consumer prices, yesterday’s analysis on wholesale prices didn’t raise any red flags. Prices in June were flat compared with May. That was softer than economist estimates for a gain of 0.2%. Overall, prices were up 2.3% year over year, below the 2.5% forecast. The drama du jour yesterday was an escalated version of the Trump Hates Powell show. A White House official told reporters that President Donald Trump was “likely” to fire Federal Reserve Chairman Jerome Powell “soon.” About 45 minutes later, Trump downplayed the statement from the Oval Office, saying it is “highly unlikely” he will fire Powell in the near future. Earnings announcement and tariff talks are likely to be the main market catalysts over the near term.

  • Industry Group Strength:  BULLISH. As of yesterday, 106 out the 197 groups I monitor are up year-to-date. 91 groups are down for the year.
  • New Highs vs. New Lows:  BULLISH. In yesterday’s session, there were 145 new 52-week highs and 76 new 52-week lows.
  • Dow Dividend Yield:  BEARISH. The current yield for the Dow Jones Industrial Average is 1.85%. The 10-year Treasury now 4.45%.
  • Volatility Index: BEARISH. Volatility has been volatile. The “VIX” is now about 17, UP from 16 as two weeks ago. The index is also known as the “Fear Index.” It is considered a contrarian indicator and therefore viewed as bullish as it rises indicating investors are becoming more fearful. The VIX:
  • Fear / Greed Index:  BEARISH.  Investors are driven by two emotions: fear and greed. Too much fear can create a condition of oversold/ undervalued stock prices. Too much greed can result in overbought/overvalued stock prices. The AAII Investor Sentiment Index is now neutral.   BE FEARFUL WHEN OTHERS ARE GREEDY. At 74, the Fear & Greed Index is UP from 59 two weeks ago.

CLICK VIDEO FOR MORE ON THE “FEAR & GREED INDEX”

How CNNMoney’s Fear & Greed Index works

  • Bull / Bear Barometer:  BEARISH. This secondary market indicator should also be viewed with a contrarian perspective. As of yesterday, according to the latest survey of stock market newsletter writers by Investor’s Intelligence, the bullish tally is 54.7% UP from 38.8% 2 weeks ago. The bears are 20.8%, DOWN from 28.6% 2 weeks ago. Consider this a contrarian indicator because the crowd is often wrong at market tops and bottoms. In other words, extreme bullishness has been seen near several market tops in the past, while extreme bearishness has been seen at market bottoms.
  • Put / Call Ratio:  BEARISH. The ratio of put-to-call options is 0.68, down from 0.49 2 weeks ago. The put-call ratio tracks the mood of what options investors are doing, not just saying. They typically buy puts if they think a stock will decline and calls if they think it will rise. If they’re buying lots of puts, they see the market declining. And if they’re loading up on calls, they’re generally bullish. Historically, market bottoms occurred when the reading spikes to 1.2 or more. Market tops are often made when the reading is 0.6 or less. Note how reliable this is with respect to the February record low coinciding with the market high. Keep in mind this is also a contrarian indicator.

ECONOMIC UPDATES

Global Economic Indicators & Analysis:

POSITIVE INDICATORS

Jobless Claims Down: Initial jobless claims fell by 7,000 to 221,000 in the last week, the Labor Department said today. That’s the fifth straight weekly decline. Claims are at their lowest level since mid-April. Economists polled by the Wall Street Journal had estimated new claims would rise by 7,000 to 234,000. Last week claims rose a revised 4,000 to 228,000, compared with the initial estimate of a drop of 5,000 to 227,000. The number of new claims based on actual filings — that is, before seasonal adjustments — rose by 19,539 to 260,900 in the latest week. The number of people already collecting unemployment benefits in the week of July 5 rose by 2,000 to 1.96 million, the government said.

Industrial Production Up: Industrial production increased 0.3% in June after remaining unchanged in April and May; for the second quarter as a whole, IP increased at an annual rate of 1.1%. In June, manufacturing output ticked up 0.1%, and the index for mining decreased 0.3%. The index for utilities rose 2.8%. At 104.0 percent of its 2017 average, total IP in June was 0.7% above its year-earlier level. Capacity utilization moved up to 77.6%, a rate that is 2.0 percentage points below its long-run (1972–2024) average.

Retail Sales Up: Sales at retailers rebounded in June after the White House dialed back high U.S. tariffs. Consumers appeared to temporarily shrug off the trade wars and spent more on cars, clothes, do-it-yourself projects and dining out. Receipts at retail cash registers rose 0.6% last month, the government said today, based on seasonally adjusted numbers. That was three times the Wall Street estimate. Sales had tumbled in May at the height of the trade wars. Vehicle sales showed the biggest increase among retailers. Americans are trying to time their purchases to avoid tariff-related price increases. Gasoline sales were flat, reflecting lower prices at the pump. If cars and gasoline are excluded, U.S. retail sales still rose a solid 0.6% last month. Those two categories often mask the underlying sales trends among retailers more generally. One of the key categories to watch, restaurant sales, rose a healthy 0.6% and also recovered from a swoon in May.

Beige Book Less Pessimistic: A sluggish U.S. economy grew slightly faster in the past month after trade wars eased, but companies were hesitant to hire and many began to partially raise prices to offset higher tariffs, according to the most recent Federal Reserve report known as the Beige Book released yesterday. The Fed’s periodic evaluation of the economy showed some improvement in growth since the last report in May, when U.S. tariffs were at their zenith. The Trump White House then dialed back duties to allow for further trade negotiations with other countries. Yet the Fed also called the outlook for the economy “neutral to slightly pessimistic” based on conversations with business leaders across the country. So far there’s only been scattered evidence of tariff-related inflation, but many economists still believe more upward pressure on prices will become evident in the next few months. The Beige Book concurred with that assessment. All 12 regional Fed banks said they experienced higher costs for supplies due to tariffs, especially for raw materials.

Home Builder Confidence Up: Home-builder confidence was up marginally in July, as demand for homes remains weak and as builders ramp up price cuts in a frenzied attempt to boost sales. Builders’ sentiment rose 1 point in July, boosted by the passage of President Donald Trump’s One Big Beautiful Bill Act, but it remains low overall due to concerns about high interest rates and economic and policy uncertainty that could keep the pace of home sales sluggish. The National Association of Home Builders’ monthly confidence index rose 1 point in July to 33, the industry group said on Thursday. A year ago, the index stood at 41. High home prices and 7% mortgage rates are weighing on the housing market. Home sales remain anemic as buyers find little reason to jump in. They’re also reluctant to buy because the future of the U.S. economy looks uncertain. “The housing sector has weakened in 2025 due to poor affordability conditions, particularly from elevated interest rates,” Buddy Hughes, a home builder and developer from Lexington, N.C., and the chair of the NAHB, said in a statement.

WEAK INDICATORS

CPI Up: Consumer prices in June posted the biggest increase since the beginning of the year and are likely to keep the Federal Reserve from cutting interest rates later this month, but there were only scattered signs of tariff-related inflation. The consumer-price index rose 0.3% last month, the government said Tuesday, and matched Wall Street’s forecast. It was the biggest rise since January. Higher gasoline prices and the cost of shelter drove the bulk of the increase in inflation last month. As a result, the crucial core rate of inflation rose a more modest 0.2% in June. The core rate strips out food and gas and is viewed by the Fed as a better predictor of future inflation trends. The overall rate of inflation in the past year climbed to 2.7% from 2.4% in the prior month. The yearly increase in the core CPI moved up to 2.9% from 2.8%. The Fed is aiming to return inflation to the low prepandemic levels of 2% or less, but the central bank’s effort has been complicated by the highest U.S. tariffs in decades. Tariffs could stoke more inflation depending on how high they are raised and how long they are kept in place. Yet many economists and top Fed officials now believe the effect on inflation is likely to prove small and short-lived.

PPI Flat, but…: Prices are still rising fast enough to delay a reduction in U.S. interest rates. Wholesale prices were unchanged in June and showed only a mild effect from U.S. tariffs, adding to the growing view that trade wars won’t lead to a big surge in inflation. The flat reading in the producer-price index came in below the Wall Street forecast of a 0.2% increase. So-called core wholesale prices were also unchanged last month. Core prices omit volatile food and energy costs as well as trade margins and are seen as a better predictor of future inflation. The wholesale report doesn’t capture the cost of imports as well as the consumer-price index, which showed a sharper increase. The rise in the cost of living in June probably killed the already slim chance of the Federal Reserve cutting interest rates later this month. Wholesale prices reflect the costs companies pay for supplies or for products they intend to sell directly to consumers. When these prices change, it usually influences the rate of inflation.

NFIB Down slightly: The National Federation of Independent Business (NFIB) Small Business Optimism Index remained steady in June, edging down 0.2 of a point to 98.6, slightly above the 51-year average of 98. A substantial increase in respondents reporting excess inventories contributed the most to the decline in the index. The Uncertainty Index decreased by five points from May to 89. Nineteen percent of small business owners reported taxes as their single most important problem, up one point from May and ranking as the top problem again. The last time taxes reached 19 percent was in July 2021. “Small business optimism remained steady in June while uncertainty fell,” said NFIB Chief Economist Bill Dunkelberg. “Taxes remain the top issue on Main Street, but many others are still concerned about labor quality and high labor costs.”

Call me if you have any questions. I am always happy to help!

John J. Gardner, CFP®, CPM®.

Blackhawk Wealth Advisors, Inc.

3860 Blackhawk Rd. Ste. 160 Danville, CA. 94506

Phone: 888-985-PLAN · Email: jg@blackhawkwealthadvisors.com

BLACKHAWKWEALTHADVISORS.COM

For my Quarterly Market Focus podcast, click on the link below. I provide a recap of market action in the quarter just passed with a focus on the stock market’s highlights and then a look forward to the quarter ahead with some insights and perspectives that I hope will help you with what to expect in the next 90 days.

810c9060-6bc9-4e20-948f-60bee7c1b0be image
dc6d6594-dfce-48b0-8d69-3a27db12748d image
7d2eabf6-51c8-425f-b667-128ed7bc0dd2 image

Blackhawk Wealth Advisors is the parent corporation of Equity Research & Portfolio Evaluation and Blackhawk Asset Management. Its founder and President is John J. Gardner. John is a Certified Financial Planner (CFP®) and Certified Portfolio Manager (CPM®). As an AIF®, John is also an Accredited Investment Fiduciary.

CUSTOMIZED. STRATEGIC. DYNAMIC.