ERPE Excerpts 6.6.24 40-year Bond Bull Market – is it over?

dc6d6594-dfce-48b0-8d69-3a27db12748d image

Presents our

Bi-Monthly

 ERPE Excerpts

John J. Gardner, CFP®, CPM®

blackhawkwealthadvisors.com

Bi-MONTHLY MARKET ANALYSIS &

ECONOMIC UPDATES

June 6, 2024

40-year Bond Bull Market

Is it over?

Is it over? The greatest bond bull market in history started over 40-years ago. The answer to “is it over?” is – – it has been. A better question is, “what is the next trend for the bond market?” As always, its future depends on interest rates. A basic rule of investing in bonds is that bond prices move inversely to interest rates. So, when interest rates (as can be seen with the 30-year Treasury bond yield graph below) touched 14% 40 years ago this past week, bond prices began to rise as rates fell. From the May 31, 1984 high, long-term Treasury yields continued on a steady, stair-step decline for decades, all the way to nearly 0% in the 2020 depths of the Covid-19 crisis.

Consequently, bond prices soared. Data shows that the benchmark 10-year Treasury had total returns (interest + appreciation) of 25.71% in 1985 and 24.28% in 1986. I had just started by career as an investment advisor in October of 1984 and had been trained to view stocks as growth investments for investors with some tolerance for risk. Bonds were for conservative investors who wanted little or no risk and were happy to receive the interest the bonds paid and their money back at maturity.  Stocks, with their inherent risks, had compounded at about 10% a year, historically. These bond returns were growing at more than double the average stock gains with investment principal backed by the U.S. government. Since the 40-year ago peak in rates, long term bonds gained in price. This long bull run came to an end in March of 2022. After falling to nearly 0%!, the Federal Reserve bank raised interest rates for the first time since 2018. The rate increase was only a quarter of a point (0.25%) to a level of 0.25–0.50%. This was in an effort to stop run-away inflation that peaked at 9.1% in June 2022. The Fed continued one of the most aggressive rate hiking campaigns in history by raising rates 11 times, with the last one in July of 2023. Its final rate hike was another 0.25% increase, bringing rates to 5.25–5.50%. That felt like going from 0 to 60mph in 2 seconds.

You know what happens to bond prices when interest rates go up – -bonds go down.

This chart shows that:

As you can see, the value of the 20-year Treasury Index – a proxy for a U.S. government long bond – fell almost by half from its pre-Fed rate hike high of around $155 to last November’s low of nearly $82. Why the jump in price since then? Hope for lower interest rates…. So, the great 40-year bond bull market really is over since it has suffered a severe bear market since 2022.

TAKING PERSPECTIVE

Proper Perspective:  In our hectic and often hard to comprehend world, it is very easy to lose perspective. You may agree it is sometimes difficult to see the big picture. The media often doesn’t help with this, but unfortunately instead encourages us to see things in a most negative light. Here is hopefully a pause to gain positive perspective.

Famous Quote For Today:

“They fight not for the lust of conquest. They fight to end conquest. They fight to liberate.” — President Franklin D. Roosevelt’s official address announcing the invasion.

What Happened On This Day June 6, – Today marks the 80th anniversary of the Battle of Normandy—the day in 1944 when allied forces from 13 countries stormed five beaches in Normandy, France, marking the beginning of the end of World War II. Planned under the codename Operation Overlord, the attack by sea and air included almost 156,000 allied troops from the United States, Canada, England, and several other countries and is considered the largest military invasion ever assembled.

MARKET ANALYSIS

INDICATORS OF INTEREST:

  • Market’s Current Signal: Market in Confirmed Uptrend.  Analysis of the stock market over 130 years of history shows we can view it in terms of three stages – market in uptrend, uptrend under pressure and market correction. I analogize this to a traffic signal’s changing colors from green to yellow and then to red. It is still green. Since the 1880’s, this perspective has led to investment out-performance relative to market indexes. This is due to trend analysis which determines risk reducing, return enhancing market entry and exit points.

The Stock Market Trend: Confirmed Uptrend. From November 1 to last week the market was in a Confirmed Uptrend. Market action on April 12 triggered the weakened trend signal to Uptrend Under Pressure. After running higher 18 out of 22 weeks, the SP 500 fell 3 consecutive weeks. May 16 market action changed that again, triggering a positive trend change back to Confirmed Uptrend.

Here are key market levels as of Monday, June 3.

Recapping Last Week

U.S. equities declined modestly in a shortened week after a sharp jump in interest rates was tempered by an in-line inflation reading. The Nasdaq Composite index fell more than 1%, while the S&P500 lost 0.5% and the Russell 2000 was flat. Eight of eleven S&P500 sectors finished higher, with energy up 2%, while technology sank 2.5% after five straight weekly gains. Crude oil prices were little changed ahead of the OPEC+ meeting, while gold futures added 0.5%. U.S. Treasury yields spiked Tuesday after a weak 5-year note auction and continued to climb on Wednesday, with the 10-year yield reaching a one-month high near 4.64%. However, rates eased after April’s core PCE index rose 0.2%, meeting expectations and slowing from the prior month. The annual gain was 2.8%, same as the past two months. The second estimate of Q1 GDP growth was revised down to 1.3% from 1.6%, primarily reflecting a downturn in consumer spending. That could also be good news on the inflation front, but a deeper look showed that the economy’s core is still expanding at a healthy clip. At week’s end, Fed funds futures implied a 50% chance of a rate cut in September, with no more than two cuts forecast for this year. In other economic news, U.S. consumer confidence rose in May despite expectations for inflation and interest rates to remain high. Home prices reached a record high in March, jumping 6.5% YoY, while pending home sales plunged 7.7% MoM after mortgage rates soared.

Feeling a bit bearish? Market cracks can cause concern…

Internationally, Eurozone inflation came in higher at 2.6% YoY, but the European Central Bank is still expected to lower interest rates at the June 6 meeting. However, services inflation leapt to 4.1% from 3.7%, so additional cuts may be in doubt. In Germany, sentiment surveys stagnated, while retail sales slumped 1.2% in April. The IMF raised China’s economic growth forecast for this year and next, but disappointing PMI results for May implied that domestic demand is still lagging in that country. Lastly, core CPI excluding energy costs in Japan’s capital eased and factory activity fell, complicating the Bank of Japan’s plans to consider further interest rate hikes.

Current View

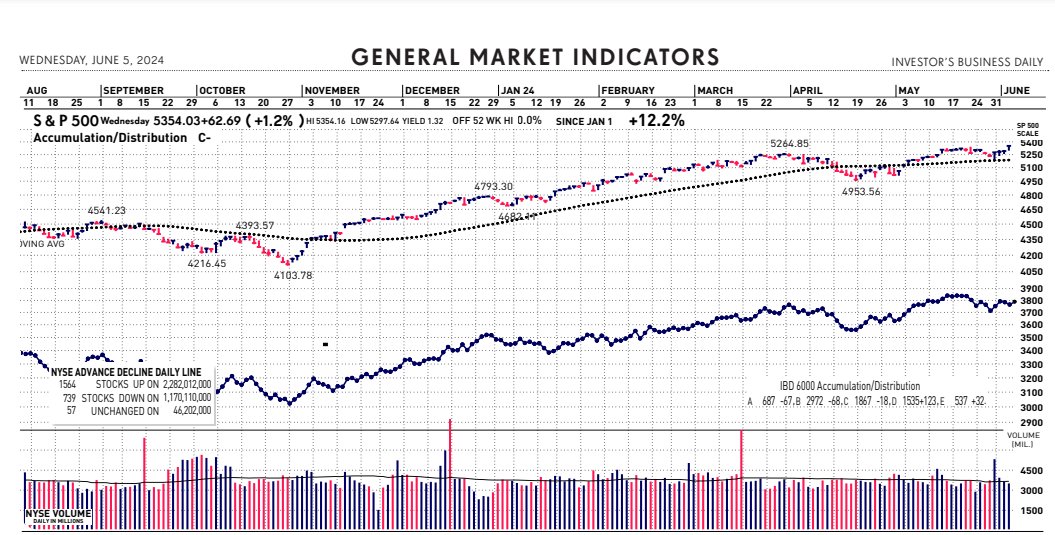
Growth stocks prevailed yesterday. The stock market displayed bullish action on a number of fronts: One, breakouts by highly rated growth stocks looked quite decent. Two, the Nasdaq and S&P 500, bastions of high-performance, high-growth companies, rose to all-time highs. A third and clear expression of growth stock leadership currently is yesterday’s market index action. The Nasdaq composite jumped 2% on a bullish increase in volume. At 17,187, it gushed to an all-time peak. The Nasdaq also lifted its year-to-date gain to 14.5%. The tech-rich index finished at its session high. That, offers a strong hint that institutional investors were loading up on growth stocks. Meanwhile, the S&P 500 rose 1.2% to 5354, also good for an all-time high. Volume on the New York Stock Exchange shrank modestly. In weaker action, the Dow Jones Industrial Average, full of blue chips that are not necessarily growing very fast, couldn’t seem to get out of its own way. The Russell indexes also reflected a lack of buying enthusiasm for so-called cheap stocks. So far this year the is up 3%. The Russell 2000 small cap index is just up 1.8%. Again, its the mega-cap techs stocks that are leading the bull market charge. The Semiconductor index(SOXX), dominated by its exposure to Nvidia, is up 26.4% through yesterday. The IShares Expanded Tech-Software IGV, is down 1.4%. So, not all tech stocks are up this year.

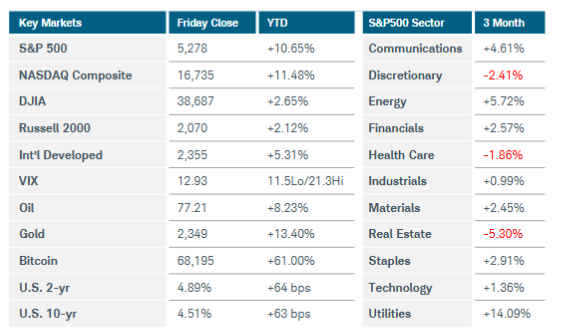
Bond markets reacted bullishly for growth stocks. How? For starters, the yield on the benchmark U.S. Treasury 10-year note dropped 4 basis points to 4.28%. Lower interest rates over a long time frame encourages stock investment, stock buybacks, acquisitions and continued cash dividends payments to shareholders. Also, some market participants still believe the Federal Reserve has both time and the motives to cut interest rates on the short end of the yield curve. According to CME FedWatch, fed funds rate futures activity pointed to a nearly 71% possibility that the Fed will trim the fed funds rate by at least a quarter point at the September 18 meeting. That’s up from a 47% chance a week ago.

  • Industry Group Strength:  BULLISH. As of yesterday, 126 out the 197 groups I monitor are up year-to-date. 71 are down.
  • New Highs vs. New Lows: BULLISH.  In yesterday’s session, there were 211 new 52-week highs and 124 new 52-week lows.
  • Dow Dividend Yield:  BEARISH. The current yield for the Dow Jones Industrial Average is 1.97%. The 10-year Treasury now 4.29%. This rate is up from 4.36% 2 weeks ago.
  • Volatility Index: BEARISH. Volatility has been volatile. The “VIX” is near 13. It is up from 12 a 2 weeks ago. The index is also known as the “Fear Index.” It is considered a contrarian indicator and therefore viewed as bullish as it rises indicating investors are becoming more fearful. The VIX:
502fdd07-23bc-47a7-ad04-cc3b3f2387db image
  • Fear / Greed Index: BEARISH.  Investors are driven by two emotions: fear and greed. Too much fear can create a condition of oversold/ undervalued stock prices. Too much greed can result in overbought/overvalued stock prices. The AAII Investor Sentiment Index is now neutral.   BE FEARFUL WHEN OTHERS ARE GREEDY. At 44, the Fear & Greed Index is down from 59 a month ago.

CLICK VIDEO FOR MORE ON THE “FEAR & GREED INDEX”

How CNNMoney’s Fear & Greed Index works

  • Bull / Bear Barometer:  BEARISH. This secondary market indicator should also be viewed with a contrarian perspective. As of yesterday, according to the latest survey of stock market newsletter writers by Investor’s Intelligence (see below), bullish sentiment is 57.6%. The bear sentiment is now 18.2%. This reflects a small drop in bullish and rise in bearish sentiment. Consider this a contrarian indicator because the crowd is often wrong at market tops and bottoms. In other words, extreme bullishness has been seen near several market tops in the past, while extreme bearishness has been seen at market bottoms.  Note how close market sentiment is near the 5-year bullish high and near the 5-year bearish low…
  • Put / Call Ratio: BEARISH. The ratio of put-to-call options is 0.33.  It is down from .50 2 weeks ago. The put-call ratio tracks the mood of what options investors are doing, not just saying. They typically buy puts if they think a stock will decline and calls if they think it will rise. If they’re buying lots of puts, they see the market declining. And if they’re loading up on calls, they’re generally bullish. Historically, market bottoms occurred when the reading spikes to 1.2 or more. Market tops are often made when the reading is 0.6 or less. Note how reliable this is with respect to the February record low coinciding with the market high. Keep in mind this is also a contrarian indicator.

ECONOMIC UPDATES

Global Economic Indicators & Analysis:

POSITIVE INDICATORS

U.S Trade Deficit Up, Shows Strong Demand: The trade deficit surged by almost 9% in April, to a one-and-a-half-year high, because of an increase in imports, a sign that a steadily growing U.S. economy still has plenty of demand. The bigger trade gap could weigh on gross domestic product, the official measure of the U.S. economy, in the second quarter. A wider deficit also depressed first-quarter GDP. Yet the increase in the deficit in April was largely tied to greater demand for cars and industrial supplies, which would be a positive sign for the U.S. economy. A strong dollar has also made foreign goods less expensive and overseas travel relatively cheaper for Americans. A wide U.S. trade deficit reflects both a stronger U.S. economy compared with other countries and a stronger dollar that makes foreign goods cheaper to buy.

U.S. Productivity Slightly Up: The productivity of American workers rose by a revised 0.2% annual rate in the first quarter, the government said this morning. The increase was originally put at 0.3% in the preliminary report last month. Output, or the amount of goods and services produced, was somewhat weaker than previously reported. The increase was lowered to 0.9% from 1.3%. The decline in productivity was due to the downward revision to GDP growth reported last week. Economists expect productivity to recover later this year. Businesses are likely to push for labor-saving strategies to avoid paying higher wages that eat into profit margins.

Jobless Claims Up, but No Sign of Layoffs: The number of Americans who applied for unemployment benefits last week rose to a four-week high of 229,000 — likely in part due to the end of the school year — but there was little sign of rising layoffs. Initial jobless claims have hovered between 194,000 and 232,000 this year, a remarkably low level last achieved consistently in the 1960s. Omitting seasonal adjustments, actual new claims fell slightly last week to 195,430. They were also below the key 200,000 line for the ninth time this year, a remarkably low level. Businesses are not hiring as many workers, but they also aren’t cutting many jobs. Sales are still pretty strong and good help is hard to find, giving firms little incentive to shrink staff.

ISM Services Sector Bounces Back: The Institute for Supply Management said on Wednesday that its service-sector PMI rebounded to 53.8% in May from 49.4% in the prior month. Thirteen service industries reported growth in May, while five reported a decrease in activity.

Factory Orders Rise Again: Orders for manufactured goods rose 0.7% in April, the Commerce Department said Tuesday. That’s the third straight monthly gain. Economists see the factory sector moving sideways in coming months as high interest rates continue to crimp business investment.

U.S. Consumer Confidence Rebounds: The U.S. index of consumer confidence rebounded to 102 in May from a revised 97.5 in the prior month, the Conference Board said last Tuesday. This is the first increase in the index after three straight monthly declines. The economy seems to be growing at a steady pace but inflation has been sticky. The Atlanta Fed estimates real GDP in the second quarter is running at a 3.5% annual rate. That’s up from a 1.6% rate in the first three months of the year. Despite the growth data, according to a recent Harris Poll, 56% of Americans believe the U.S. is in a recession. This is a puzzle for polling experts. Economists tend to think that Americans are still grappling with the higher level of prices left behind after the wave of inflation.

PCE Shows Shrinking Increase: Prices in the U.S. rose again in April, the Federal Reserve’s preferred PCE index found, but a recent surge in inflation in early 2024 may have also shown signs of fading. Yet the more closely followed core rate that strips out food and energy increased by a smaller 0.2%. That’s the smallest gain since the final month of 2023. The core index is viewed by the Fed and Wall Street as a better predictor of future inflation. The core rate of inflation over the past 12 months stayed at 2.8% for the third month in a row, leaving it just shy of a three-year low.

S&P Case-Shiller Reaches New High: Home prices in the 20 biggest U.S. metros hit another all-time high, as the housing market remains hampered by a low number of properties for sale. The S&P CoreLogic Case-Shiller 20-city house price index rose 0.3% in March compared to the previous month. Home prices in the 20 major U.S. metro markets were up 7.4% in the last 12 months ending in March. Home prices in the 20 major U.S. metro markets were up 7.4% in the last 12 months ending in March. All 20 major markets reported yearly gains. When looking at prices alone, the housing sector looks remarkably resilient, as prices keep going up. But the gains are driven by a scarcity of homes for sale, and with pent-up demand pooling on the sidelines, waiting for mortgage rates to fall, prices look poised to go even higher. Until more homeowners sell their homes and open up housing supply, prices will likely be stuck in an upward trajectory.

WEAK INDICATORS

ADP Jobs Report Shows Cooling Labor Market: U.S. businesses added 152,000 new jobs in May to mark the smallest increase this year, paycheck company ADP said, in what appears to be another sign of a broader slowdown in hiring. High interest rates aimed at slowing inflation finally appear to be restraining the economy after surprisingly strong growth last year. Job openings have fallen to the lowest level in three years and hiring appears to have slowed, potentially paving the way for the Federal Reserve to cut interest rates later this year.

Job Openings Fall: The number of job openings in the U.S. sank in April to a more than three-year low of 8.1 million, another sign the labor market is cooling off as the economy slows. New openings have fallen from a record 12 million in 2022 and are now at the lowest level since early 2021. Many openings are never actually filled, but the trend in job postings provides clues about the health of the labor market and the broader economy.

U.S. Manufacturing Stalls: A key barometer of U.S. factories fell to a three-month low as new orders waned and businesses were reluctant to invest due to high interest rates. The index fell to 48.7% in May from 49.2% in the prior month. Numbers below 50% signal that the manufacturing sector is contracting. The ISM report is viewed as a window into the health of the economy. The industrial side of the economy is unlikely to generate sustained growth until interest rates fall and a lower cost of borrowing entices customers to buy more goods or invest. At the same time, higher prices of raw materials such as oil, plastics, copper and aluminum are putting upward pressure on prices. That could keep inflation elevated.

Construction Spending Falls Again: Construction spending fell in April as U.S. companies and the government scaled back projects across the country amid high interest rates. Spending on construction projects fell 0.1% in April to $2.1 trillion, the Commerce Department reported Monday. Construction spending reveals how much the government and private companies spend on projects such as housing and highways. The more the U.S. spends on construction, the higher the level of economic activity. Construction spending is down for the second month in a row.

Chicago PMI Weakens Again: The Chicago Business Barometer, also known as the Chicago PMI, fell to 35.4 in May from 37.9 in April. It is the lowest level since the pandemic in May 2020. This is the sixth consecutive reading in contraction territory.

Consumer Spending Softens: Consumer spending rose a modest 0.2% in April and suggested that persistent inflation and high interest rates could be chipping away at household buying power. Consumer spending is the main engine of U.S. growth, accounting for about 70% of the economy. The latest update on gross domestic product showed that spending rose at a mild 2% clip in the first quarter, down from 3%-plus growth in each of the prior two quarters. Whatever the case, the small increase in spending in April is likely to spur Wall Street analysts to trim their forecasts for gross domestic product in the second quarter. GDP rose just 1.3%

Pending Home Sales Plunge: Pending home sales plunged in April as buyers felt the effects of an expensive housing market. With home prices and mortgage rates rising, buyers seem to be pulling back on signing contracts on homes for sale. Pending home sales fell 7.7% in April from the previous month, according to the monthly index released last Thursday by the National Association of Realtors. Pending home sales reflect transactions where the contract has been signed for the resale of a home, but the sale has not yet closed. Economists view it as an indicator of the direction of sales of existing homes in subsequent months. Sales activity is at the lowest level since April 2020. The housing market is facing a double whammy in the form of higher mortgage rates and a scarcity of homes for sale.

Fed’s Beige Book Shows Creeping Pessimism: The U.S. economy expanded in the late spring, a Federal Reserve survey found, but persistent inflation, high interest rates and political uncertainty caused businesses to turn “somewhat more pessimistic.” The latest findings in the Beige Book suggest the economy is unlikely to speed up until inflation slows further and the Fed is able to cut high U.S. interest rates. The 2024 presidential election also appears to be weighing on the economy, the survey indicated. Ten of the Fed’s 12 regional banks said their regional economies reported slight or modest growth, the same as in March. Two reported no change. Inflation rose again, the Fed said, but consumer pushback forced some businesses to reconsider price increases and accept smaller profit margins. More companies also offered discounts. Persistent inflation has pressured the Fed to delay plans to cut interest rates, which would bring relief to home buyers in particular and the economy more generally. More labor is available, businesses told the Fed, although there are still acute shortages for some jobs. Wage growth continued to slow, and some Fed regions said increases in pay were reverting to lower pre-pandemic norms.

Call me if you have any questions. I am always happy to help!

John J. Gardner, CFP®, CPM®, AIF®

Blackhawk Wealth Advisors, Inc.

3860 Blackhawk Rd. Ste. 160 Danville, CA. 94506

Phone: 888-985-PLAN · Email: jg@blackhawkwealthadvisors.com

BLACKHAWKWEALTHADVISORS.COM

For my Market Monthly podcast, click on the link below. I provide a review of global stock market highlights over the past month and preview of the month ahead. Forward insights and perspectives are based on current financial market and economic trends with an emphasis on relevant developments in various areas from Fed policy to company earnings announcements.

Link to Market Monthly Podcast