ERPE Excerpts 6.4.26 The 3 A’s Market

The “3 A’s” Market
2026 Bull Market Drivers: Aging Boomers, AI & Asset Valuations Rising
The U.S. stock market is now experiencing one of the greatest bull markets in history. Just a few quick stats: the SP 500 index rose last week for the 9th consecutive week, the longest win streak since December of 2023. This has only happened 10 times in history.  If it closes this week higher, it would be the longest run up weeks since 1985. After the historic 10% rally in April, the S&P 500 added another 5% in May. This was the second-best April/May return ever, with only the 17.8% rally in 2020 better. What’s helping boost this bull? The current market cycle isn’t just about quarterly earnings beats and hope in Hormuz reopening soon. It is being propelled by three massive, interconnected structural trends: Aging Boomers, Asset Values Rising, and Artificial Intelligence. Together, they form the foundation of the “3 A’s Market”. Think of these three as the triple engines fueling the bull market…
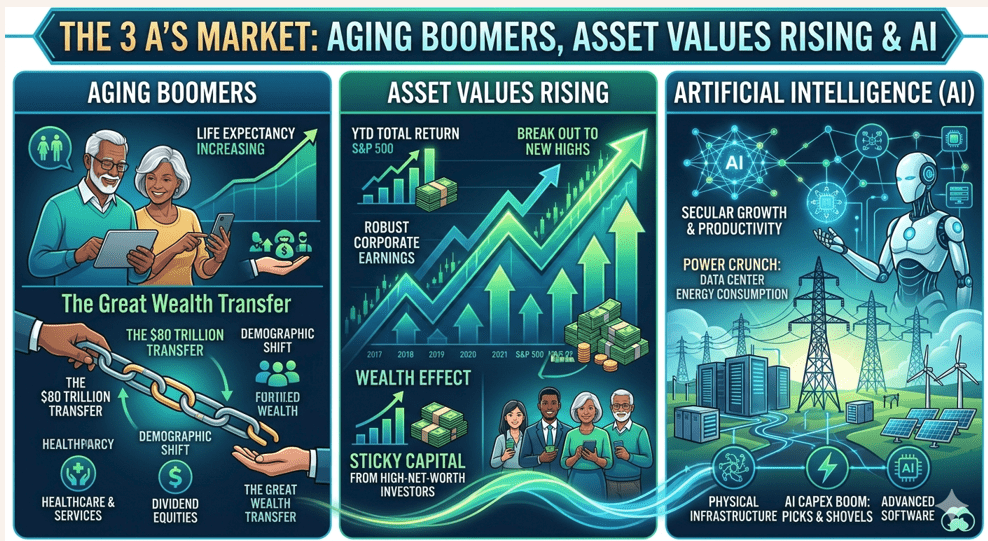
Aging Boomers: The “Sticky Capital” & Spending Cushion
As of 2026, the very first Baby Boomers (born in 1946) are turning 80 years old. Boomers and older generations currently hold over $80 trillion in wealth. This generation comprises roughly 20% of the U.S. population (approximately 67 million people). Counter to old economic theories that seniors dump stocks the moment they retire, Boomers are actually acting as a major pillar of support for equities. With trillions remaining in retirement accounts, Boomers aren’t abandoning equities; they remain invested in high-quality, dividend-paying, and cash-flow-rich mega-cap stocks. This massive, institutionalized pool of “sticky capital” keeps a high floor under stock prices, dampening market pullbacks. And because this wealthiest demographic in history is sitting on over $80 trillion, they may be the most powerful of the three engines boosting the bull market. Their ongoing consumer spending power is impactful — particularly on healthcare, travel, and high-end services. This a solid backstop for U.S. GDP. This demand directly drives corporate revenues in many market sectors and industry groups.
Asset Values Rising: The Wealth Effect & Firing on All Cylinders
Despite persistent calls for a cyclical slowdown over the past couple of years, traditional equity assets have shown incredible resilience, driven by corporate profitability and solid economic foundations. the stock market is not the only asset class enjoying rising values; so is the real estate market. Rising markets cause the “Wealth Effect”. As portfolios, retirement accounts, and home equity values climb, affluent consumers feel wealthier, which directly translates into sustained economic activity and corporate earnings growth. This second catalyst of the current bull market is closely related to the first one – the Boomers. They have simply had the most time to accumulate and compound their net worth as they have mostly held stocks and real estate for decades and have benefited from exceptional asset value appreciation. This wealth effect is very real. The economic reality is it stimulates growth through increased consumer spending which is the most important leg of the “economic stool”. Another core reason this bull market has been so resilient is that corporate America has mostly maintained and expanded its profit margins. Companies aren’t just riding inflation; they are growing real earnings. When earnings grow, stock prices naturally follow. As I often say, “Earnings are the single most important determining factor of stock prices”. Then there’s the psychological effects rising asset values have on the stock market. For one, FOMO. The fear of missing out, an emotional market driver, lifts the stock market (at least over the short term). Rising valuations begets higher valuations as money that is out of an asset class flows in. This creates a self-reinforcing wave of buying pressure that drives the market to new heights.
Artificial Intelligence: The Ultimate Productivity & CapEx Multiplier
AI is the crown jewel of this bull market. It provides both the fundamental growth and the visionary narrative that historic bull markets feed on. Doesn’t that sound like something you would have heard in the late 1990’s? AI is phenomenal fuel for a bull market in stocks just like the internet powered the dot.com bull market of the 90’s. Every secular bull market needs a transformative narrative, and AI technology is this one’s. Investors are simply willing to pay a premium for companies that promise exponential productivity gains which can be seen in today’s rapidly expanding stock valuation multiples. Speaking of multiplying – money being spent (capital expenditures “CapEx) on AI is leaping by the hundreds of billions! I just read a research piece by Goldman Sachs saying they are now forecasting that the big spenders on AI will be a combined $5.3 TRILLION between 2025 and 2030. Their previous estimate was $4.5 trillion. This is staggering money. That cash is flowing directly into the bank accounts of infrastructure companies, energy providers, grid developers, and hardware manufacturers. This massive capital rotation is breathing prolonged life into industrial, materials, and energy sectors, widening the market’s breadth. Here’s perspective on the enormous AI cap-ex: Driven by the dot-com boom, telecommunication and broadband companies invested over $2.2 trillion in telecom and fiber-optic infrastructure to support the internet.
This isn’t a fragile bull market built on cheap debt or central bank gimmicks like we’ve seen in past rising markets, it is being driven by the fundamental reality of the 3 A’s. Together, they create a highly resilient foundation for equities. However, as a mentor of mine used to say, “Trees don’t grow to sky.” There’s a limit all growth. The “Boom/Bust” cycle is also a reality. As we are living the boom now, we should be prepared for bust. FOMO can quickly turn into FOBI (the Fear of Being In).

TAKING PERSPECTIVE…

Proper Perspective:  In our hectic and often hard to comprehend world, it is very easy to lose perspective. You may agree it is sometimes difficult to see the big picture. The media often doesn’t help with this, but unfortunately instead encourages us to see things in a most negative light. Here is hopefully a pause to gain positive perspective.
Famous Quote For Today:  “The cemetery of the victims of human cruelty in our century is extended to include yet another vast cemetery, that of the unborn.”
~~ Pope John Paul II, 1991
Today in History – On this day in 1876 – Transcontinental Express, arrives in San Francisco, 83 hr 39 min. after leaving NYC.

MARKET ANALYSIS

INDICATORS OF INTEREST:
  • Market’s Current Signal: Confirmed Uptrend.  Analysis of the stock market over 130 years of history shows we can view it in terms of three stages -market in uptrend, uptrend under pressure and market correction.  Since the 1880’s, this perspective has led to investment out-performance relative to market indexes. This is due to trend analysis which determines risk reducing, return enhancing market entry and exit points.
The U.S. stock market’s current signal indicates the market is in Confirmed Uptrend. This trend change was triggered April 8, confirming a rally attempt on March 31. The bullish rally remains strongly intact. April was the best month for the stock market since 2020. May also delivered a strong gain. Between April and May, the last two months were the 2nd best April/May periods in stock market history.
Here are key market levels as of Monday, June 1:
Recapping Last Week
U.S. equities extended their rally for a ninth consecutive week, with the S&P 500 climbing as easing oil prices, resilient earnings, and AI-linked momentum overcame inflation concerns. Alongside the S&P, the Nasdaq-100, Nasdaq Composite, and DJIA all closed at record highs on Friday, with only the Russell 2000 pulling back a touch from Thursday’s record close. Dell’s (DELL) earnings blowout announcement was just the latest example in a growing list of companies benefiting by massive AI infrastructure spending in a week that also saw Micron (MU) join the trillion-dollar market cap club. S&P 500 sector performance favored growth and technology, while consumer discretionary responded well to the lessening of inflation expectations amid a sharp drop in energy prices which in turn lessened the likelihood of rate hikes. Of course, the flip side of the sector performance coin was energy as the worst performer followed by consumer staples. U.S. Treasury yields eased throughout the week, improving risk sentiment, though the broader rate backdrop remains fragile. The 10 – year settled below 4.5% and the 30-year under 5%, while the 2-year note, more sensitive to short-term rate expectations, remained above 4%.
In foreign markets, currency markets were quiet amid the minor shifting of interest rate expectations. For the Yen, this quietness masked a great deal of activity beneath the surface: over the past month the Japanese Ministry of Finance intervened in the currency markets for the first time since 2024 selling over $73 billion USD/JPY to support the Yen. As a mercantilist, export-driven economy, Japan would normally welcome a weaker currency, but in this case concerns about the nation’s dependence on dollar-denominated imported energy seems to have been the overriding concern. In spite of ongoing small-scale military skirmishes, progress on the U.S./Iran diplomatic front led to a nearly $10 per barrel decline in the price of oil. U.S. priorities seem to be getting the Strait of Hormuz open even while Iran, through its public statements, isn’t backing down from what they claim is their right to enrich uranium. For now, the market seems focused on the prospect for oil to be able to make it’s way out of the Persian Gulf again. Precious metals were quiet, apparently neither a risk-on nor risk-off proxy this week, while over the past two weeks, the insatiable demand for tech stocks has led to a negative correlation of crypto with equities.
Current View
The stock market took a broad hit on yesterday as oil and the interest rates rose. The Nasdaq composite briefly looked set to rise for a 10th straight session, but closed down. It is up sharply from the April 8 follow-through day and, through yesterday, is up 15.5% ytd. Breadth was notably negative in stock market in yesterday’s action. Decliners beat gainers by roughly a 3-1 ratio on the New York Stock Exchange. On the Nasdaq, losers exceeded winners by more than 2,000 issues. The SpaceX IPO, which reportedly plans to raise $75 billion by selling 555.6 million shares at $135 apiece, may be causing some stock selling to raise cash for the issue. More importantly, the bullish ratio of stock market newsletter writers and pundits tracked by Investors Intelligence fell to around 45.3% last week. That’s well below the 62.3% peak seen so far in 2026.
This morning is showing a mixed message as the Dow is making a new all-time record high, up over 900 points. Conversely, the tech-heavy Nasdaq is falling, led by mega-cap tech stocks down on earnings reports. Some of those are down 10%, !5% and 20%. Stocks fall faster than they rise.
Here’s my 2026 OUTLOOK.
  • Industry Group Strength:  BEARISH. As of yesterday, 69 out the 145groups I monitor are up year-to-date. 76 are down.
  • New Highs vs. New Lows: BULLISH.  In yesterday’s session, there were 282 new 52-week highs and 186 new 52-week lows.
  • Dow Dividend Yield:  BEARISH. The current yield for the Dow Jones Industrial Average is 1.76%. The 10-year Treasury now 4.47%.
  • Volatility Index: BEARISH. Volatility has been volatile. The “VIX” is now 15. This is down from 17 two weeks ago. The index is also known as the “Fear Index.” It is considered a contrarian indicator and therefore viewed as bullish as it rises indicating investors are becoming more fearful. The VIX:
502fdd07-23bc-47a7-ad04-cc3b3f2387db image
  • Fear / Greed Index: NEUTRAL.  Investors are driven by two emotions: fear and greed. Too much fear can create a condition of oversold/ undervalued stock prices. Too much greed can result in overbought/overvalued stock prices. The AAII Investor Sentiment Index is now neutral.   BE FEARFUL WHEN OTHERS ARE GREEDY. At 54, the Fear & Greed Index is down from 68  two weeks ago.
CLICK VIDEO FOR MORE ON THE “FEAR & GREED INDEX”
  • Bull / Bear Barometer:  NEUTRAL. This secondary market indicator should also be viewed with a contrarian perspective. As of yesterday, according to the latest survey of stock market newsletter writers by Investor’s Intelligence, the bullish tally is 50.9%, up from 47.3% two weeks ago. The bears are 20%, down from 23.6% two weeks ago. Consider this a contrarian indicator because the crowd is often wrong at market tops and bottoms. In other words, extreme bullishness has been seen near several market tops in the past, while extreme bearishness has been seen at market bottoms.
  • Put / Call Ratio: BEARISH. The ratio of put-to-call options is .61, down from 0.76 two weeks ago. The put-call ratio tracks the mood of what options investors are doing, not just saying. They typically buy puts if they think a stock will decline and calls if they think it will rise. If they’re buying lots of puts, they see the market declining. And if they’re loading up on calls, they’re generally bullish. Historically, market bottoms occurred when the reading spikes to 1.2 or more. Market tops are often made when the reading is 0.6 or less. Note how reliable this is with respect to the February record low coinciding with the market high. Keep in mind this is also a contrarian indicator.

ECONOMIC UPDATES

Global Economic Indicators & Analysis:
POSITIVE INDICATORS
US Services PMI Down: The S&P Global US Services PMI eased to 50.7 in May of 2026 from 51 in the previous month, revised lower from the preliminary estimate of 50.9 and remaining below the preliminary estimate of 51.1. Despite the slowdown, the result extended the rebound from the previous month after the outbreak of war in the Middle East pressured the sector to a contraction in March. New business inflows rose modestly, as rising prices and uncertainty drove consumers to maintain their subdued demand. New business was also limited by the fastest reduction in orders from foreign clients since 2022. The muted demand for new projects drove firms to cut jobs at the fastest pace since May of 2020. On the price front, input costs for services providers rose the most in one year, driving charges to rise sharply. Looking ahead, business optimism dropped to an over three-year low.
US Factory Orders UP: US factory order surged 4.8% from the previous month to $662.7 billion in April of 2026, ahead of market expectations of 4.6% and extending the upwardly revised 1.8% increase in March, the most in 11 months. Durable goods orders jumped by 8% to $346.2 billion, aligning with results from comparable surveys as clients had front-loaded orders before the war in the Middle East could increase prices further. Orders were higher for transportation (21.6% to $131.1 billion) due to a surge in nondefense aircraft orders (165.9% to $36.79 billion). Orders also rose for fabricated metal products (3.5% to $44.5 billion) and primary metals (2% to $29.5 billion). In turn, orders fell for computers and electronics (-0.7% to $29.7 billion). Nondurable goods orders rose by 1.4% to $316.5 billion.
Durable Goods UP: New orders for manufactured durable goods in April, up two consecutive months, increased $25.5 billion or 7.9 percent to $346.0 billion, the U.S. Census Bureau announced last week. This followed a 1.3 percent March increase. Excluding transportation, new orders increased 1.1 percent. Excluding defense, new orders increased 8.1 percent. Transportation equipment, also up two consecutive months, led the increase, $23.1 billion or 21.5 percent to $130.9 billion. Shipments of manufactured durable goods in April, up seven of the last eight months, increased $1.7 billion or 0.5 percent to $324.3 billion. This followed a 0.8 percent March increase. Transportation equipment, up six of the last seven months, led the increase, $0.7 billion or 0.7 percent to $107.7 billion.

WEAK INDICATORS

Jobless Claims Up, but…: The number of people who applied for unemployment benefits at the end of May jumped to a four-month high, but not because businesses are laying off more workers. The timing of the Memorial Day holiday was a major factor. The raw or actual number of new jobless claims, on the other hand, fell slightly to 187,978. Additionally, unadjusted claims have been below 190,000 for three straight weeks, which was very uncommon before the pandemic. Anything under 200,000 is remarkably low. By all measures, layoffs are indeed extremely low. A separate government report earlier this week showed the rate of layoffs had dipped in April to 1.1%, slightly above an all-time low of 0.9% in the middle of 2024. So-called initial jobless claims shot up by 13,000 to 225,000 in the seven days ending May 30, based on seasonally adjusted government data. It was the highest level of new claims since early February.
New Home Sales Down: Sales of new single-family houses in April 2026 were at a seasonally-adjusted annual rate of 622,000, according to estimates released jointly today by the U.S. Census Bureau and the Department of Housing and Urban Development. This is 6.2% below the March 2026 rate of 663,000, and is 11.3 % below the April 2025 rate of 701,000.
Call me if you have any questions.  I am always happy to help!
John J. Gardner, CFP®, CPM®.
Blackhawk Wealth Advisors, Inc.
Phone: 888-985-PLAN · Email: jg@blackhawkwealthadvisors.com