ERPE Excerpts 5.22.2025 .. U.S. Debt Downgraded… Should You Care?

Bi-MONTHLY MARKET ANALYSIS &

ECONOMIC UPDATES

May 22, 2025

U.S. Debt Downgraded

Should You Care?

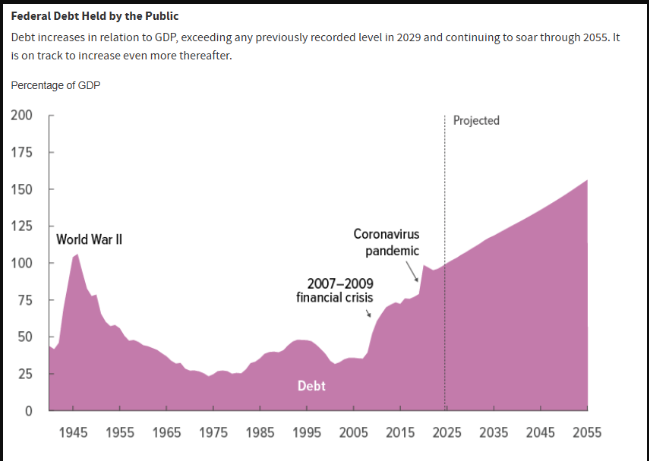
Yes, you should care about the U.S. debt downgrade. And so should the rest of American consumers and businesses, as well as investors worldwide. The potential result of this week’s U.S. debt downgrade by rating agency Moody’s is higher borrowing costs for all. While by no means does the U.S. bond rating downgrade suggest “junk”, the reduced rating knock down value of bond investments and others. Though the U.S. still holds a high credit rating, the downgrade signals a shift in perceptions of the U.S. as a safe and reliable borrower, which can affect interest rates on loans, bonds, and other investments. Thanks to Moody’s, the U.S. no longer holds the highest credit rating from any of the major agencies. The other two major bond rating agencies, Standard & Poor’s and Fitch, already dropped their rating on U.S debt instruments. S&P in 2011 and Fitch in 2023. Why have these graders of bonds all lowered their opinion and lost confidence in America’s bonds? Rising debt! The graph above indicates the rapid rate of U.S. debt increase since the late ’90’s and the projected trajectory of future increase. Here’s some reason’s the debt downgrade matters:

  • Higher Borrowing Costs:

The country’s debt downgrade can lead to investors demanding higher interest rates on U.S. government debt, like Treasury bonds. These higher interest rates can then ripple through the economy, impacting borrowing costs for consumers and businesses, including mortgages, credit cards, and personal loans. The downgrade would likely cause US Treasury yields to rise as investors see more risk in lending money to the government. This includes bond buyers around the world.

  • Market Uncertainty:

Downgrades can create uncertainty in financial markets, making investors more cautious and potentially driving down the value of certain investments. The downgrade might also lead to a flight to safety, with investors seeking more stable assets like gold or foreign bonds.

  • Impact on Investments:

Your investments, especially those in bonds or income-generating assets, could be affected by the downgrade. Rising interest rates can lead to a drop in the value of existing bonds. This is what I have long referred to as the “teeter-totter” effect. As interest rates rise, the price of bonds (and all interest-sensitive investments) go down. The downgrade could also make it harder for companies to borrow money, potentially impacting their stock prices.

  • Potential for Economic Slowdown:

Higher borrowing costs can restrain economic growth by making it more expensive for businesses to invest and hire. The downgrade could also lead to a decline in consumer spending and confidence, further slowing down the economy. Plus, the much feared economic condition known as “stagflation” becomes a greater concern.

  • Erosion of Confidence in the U.S. Dollar:

While the U.S. dollar is still the world’s reserve currency, a debt downgrade could weaken confidence in its stability and potentially lead to a decline in its value. This could make it more expensive for U.S. consumers to travel and purchase goods from overseas. Again, this could also impact the value of your investments as some prices move inversely to the dollar.

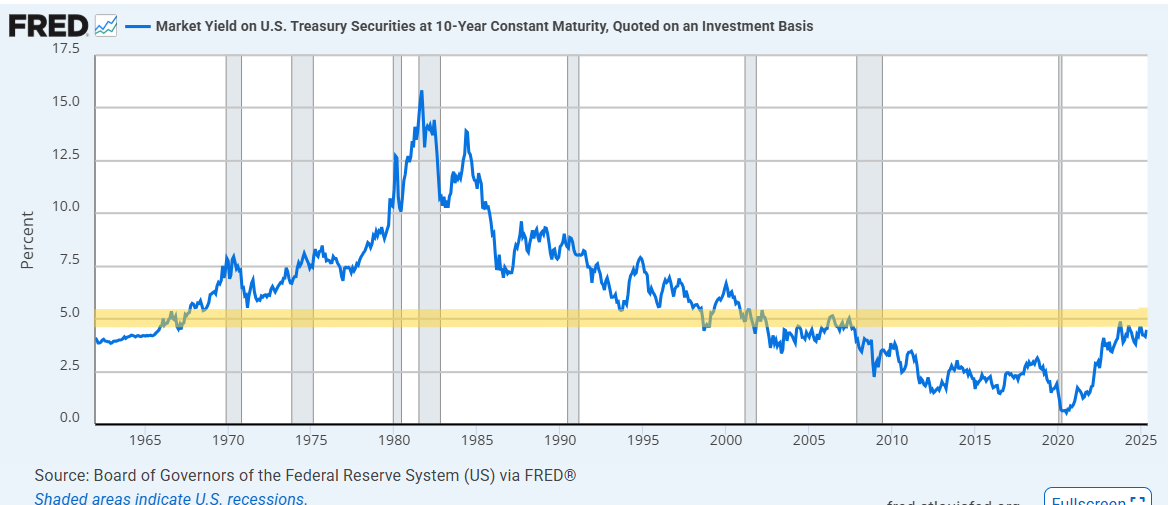
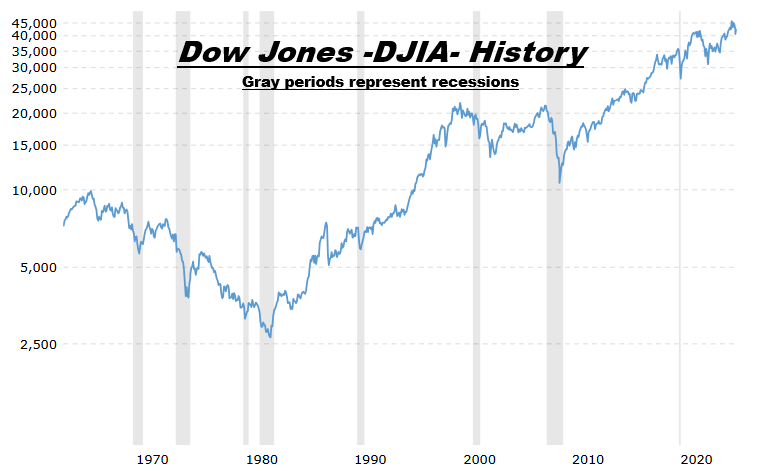
So, we know we should care and we can see why America’s credit lost its’ perfect, top-tier grade. The monumental deficit and mounting debt cost the U.S. the highest AAA status. That debt load, as predicted, is likely to rise. The Committee for a Responsible Federal Budget estimates that Trump’s “Big Beautiful Bill” would increase the deficit. “Overall, the bill would add more than $3.3 trillion to the debt over the next decade with interest – including $600 billion in 2027 alone – and add more than $5.2 trillion to the debt through 2034 if made permanent,” the committee said recently. As Republicans make progress on the President’s budget bill, bond markets are pushing back. That was evident in the financial markets yesterday. The plan includes tax and spending cuts, but would ultimately do little to curb the federal budget deficit. Some analysts, though, expect the budget plan likely won’t cause the deficit to increase. Further tax cuts will likely be offset by the administration’s new tariffs, there narrative goes…. “The upshot is that we expect the budget deficit to be broadly unchanged at close to 6% of GDP over the next few years, although that would still leave the debt burden on track to reach nearly 120% of GDP by 2034,” said one economist. I think a better choice to listen to for future market direction is the market itself, not the “experts” talking about it. The market’s message is clear: it does not trend up while interest rates are rising. The charts below show that. Notice the spike in the 10-year Treasury yield between the early ’70’s to the early ’80’s, and the relative market direction. That is an inverse relationship. Look at the yellow line the top chart yields at 5%. That is now the market’s focus. History shows stock market weakness when the 10-year is over 5% and trending higher.

Your copy should address 3 key questions: Who am I writing for (audience)? Why should they care (benefit)? What do I want them to do (call-to-action)?

Create a great offer by adding words like “free,” “personalized,” “complimentary,” or “customized.” A sense of urgency often helps readers take action, so consider inserting phrases like “for a limited time only” or “only 7 remaining!”

TAKING PERSPECTIVE…

Proper Perspective:  In our hectic and often hard to comprehend world, it is very easy to lose perspective. You may agree it is sometimes difficult to see the big picture. The media often doesn’t help with this, but unfortunately instead encourages us to see things in a most negative light. Here is hopefully a pause to gain positive perspective.

Famous Quote On This Day:  “I am inclined to look at everything as resulting from designed laws, with the details left to the working out of what we may call chance.”

~~ Charles Darwin, 1860

What Happened On this Day May 22, 1973 –  U.S. President Richard Nixon confesses his role in the Watergate cover-up.

MARKET ANALYSIS

INDICATORS OF INTEREST:

  • Market’s Current Signal: Confirmed Uptrend.  Analysis of the stock market over 130 years of history shows we can view it in terms of three stages -market in uptrend, uptrend under pressure and market correction.  Since the 1880’s, this perspective has led to investment out-performance relative to market indexes. This is due to trend analysis which determines risk reducing, return enhancing market entry and exit points. The U.S. stock market’s current signal indicates the market is in Confirmed Uptrend. That officially happened April 22.

The Stock Market Trend: Confirmed Uptrend. The stock market powered higher Tuesday, April 22 and the Nasdaq and S&P 500 confirmed new rally attempts. This follow-through signaled a Confirmed Uptrend. Last week the major stock market indexes reclaimed levels set in late February and significantly above the pre-“Liberation Day” prices.

Here are key market levels as of Monday, May 19

Recapping Last Week

U.S. equity indices rallied sharply – breaking above key technical resistance levels – after the U.S. and China reached a better-than-expected agreement to curb tariffs for the next three months. The Nasdaq Composite index soared 7.2%, while the S&P500 jumped 5.3%—into positive territory for the year—and the Russell 2000 rose 4.5%. S&P500 sector returns were overwhelmingly positive, led by strong gains in technology. The semiconductor sub-index surged 10% after the U.S. Commerce Department officially rescinded the rule restricting advanced chip exports, which had been set to take effect Thursday. Healthcare continued to lag as UnitedHealth Group’s struggles weighed on the sector. Early-week gains in crude oil were pared after a potential nuclear deal between the U.S. and Iran—OPEC’s third-largest producer—suggested that global oil supplies may increase. Gold futures slumped 4% as trade tensions eased, while Bitcoin was nearly flat for the week. U.S. Treasury yields climbed despite tame inflation reports. Fed Chair Powell warned that longer-term interest rates are likely to be higher as the economic environment changes and Fed policy adjusts. U.S. CPI rose 0.2% last month, setting the 12-month rate at 2.3%–the lowest level since February 2021. Core CPI remained elevated at 2.8% YoY as shelter prices continued to rise. Producer prices surprisingly fell in April with the cost of services declining the most since 2009. Thus far, businesses do not seem to be passing along higher costs from tariffs as profit margin measures experienced a historic drop. Unlike in recent months, investors largely shrugged off another dismal consumer sentiment report with the index falling to its second-lowest reading on record this month. Most of the survey was completed before the U.S.-China tariff pause was announced. Inflation expectations ramped up yet again with year-ahead rising to 7.3% from 6.5% and longer-term inching up to 4.6% from 4.4%. In other economic news, U.S. retail sales slowed to 0.1% growth in April as households pulled back on discretionary spending items such as airline tickets and hotels. Retail giant Walmart surpassed sales expectations last quarter but warned that tariffs will lead to higher prices starting later this month. Manufacturing activity continued to soften this month, according to surveys conducted by the New York and Philadelphia Fed, while homebuilder confidence and housing permits slumped in what is typically the stronger spring season.

Overseas, the UK economy grew more than expected in Q1 at 0.7%, although the Bank of England tempered its forecasts for the full year. Japan’s GDP contracted by 0.2% quarter-on- quarter and by 0.7% on an annualized basis as trade uncertainties caused an export drop.

Current View

Now all eyes are on the bond market. The U.S. faces a challenging fiscal outlook, with a growing national debt and rising interest rates. While the recent debt downgrade and rising 10-year Treasury yield are concerning, the market’s reaction has been relatively muted so far. It’s important to note that the U.S. still possesses significant economic strengths, including the dollar’s status as the world’s reserve currency and a dynamic economy. However, policymakers need to address the nation’s fiscal imbalances to ensure long-term economic stability.  Unrelentingly high Treasury yields and an uncertain government spending picture cast a long shadow on stocks yesterday as all three major indexes fell hard and finished the day near session lows. The Dow Jones Industrial Average took the worst of it as blue chips dropped more than 800 points.  The yield on the benchmark 10-year Treasury note kept climbing throughout the day, and was up 11 basis points to 4.59% by the time the market closed. The 5% # is the big news and new big brick in the market’s wall of worry. Who new the 20-year Treasury bond would ever so much attention?

  • Industry Group Strength:  BEARISH. As of yesterday, 73 out the 197 groups I monitor are up year-to-date. 124 groups are down for the year.
  • New Highs vs. New Lows:  BULLISH. In yesterday’s session, there were 164 new 52-week highs and 108 new 52-week lows.
  • Dow Dividend Yield:  BEARISH. The current yield for the Dow Jones Industrial Average is 1.88%. The 10-year Treasury now 4.59%.
  • Volatility Index: EUTRAL. Volatility has been volatile. The “VIX” is now about 19, down from 22 as two weeks ago. The index is also known as the “Fear Index.” It is considered a contrarian indicator and therefore viewed as bullish as it rises indicating investors are becoming more fearful. The VIX:
  • Fear / Greed Index: BEARISH.  Investors are driven by two emotions: fear and greed. Too much fear can create a condition of oversold/ undervalued stock prices. Too much greed can result in overbought/overvalued stock prices. The AAII Investor Sentiment Index is now neutral.   BE FEARFUL WHEN OTHERS ARE GREEDY. At 66, the Fear & Greed Index is up from 62 two weeks ago. Remember, the index was at 3 a 6 weeks ago!

CLICK VIDEO FOR MORE ON THE “FEAR & GREED INDEX”

How CNNMoney’s Fear & Greed Index works

  • Bull / Bear Barometer:  BULLISH. This secondary market indicator should also be viewed with a contrarian perspective. As of yesterday, according to the latest survey of stock market newsletter writers by Investor’s Intelligence, the bullish tally is 42.3% up from 32.1% 2 weeks ago. The bears are 26.9%, down from 33.9% 2 weeks ago. Consider this a contrarian indicator because the crowd is often wrong at market tops and bottoms. In other words, extreme bullishness has been seen near several market tops in the past, while extreme bearishness has been seen at market bottoms.
  • Put / Call Ratio: NEUTRAL. The ratio of put-to-call options is 0.71, down from 0.96 2 weeks ago. The put-call ratio tracks the mood of what options investors are doing, not just saying. They typically buy puts if they think a stock will decline and calls if they think it will rise. If they’re buying lots of puts, they see the market declining. And if they’re loading up on calls, they’re generally bullish. Historically, market bottoms occurred when the reading spikes to 1.2 or more. Market tops are often made when the reading is 0.6 or less. Note how reliable this is with respect to the February record low coinciding with the market high. Keep in mind this is also a contrarian indicator.

ECONOMIC UPDATES

Global Economic Indicators & Analysis:

POSITIVE INDICATORS

Jobless Claims Down:   Initial jobless claims fell by 2,000 to 227,000 in the last week, the Labor Department said today. Claims have been steady at relatively low levels for most of the year. Economists polled by The Wall Street Journal had estimated new claims would rise by 1,000 to 230,000. The number of new claims based on actual filings — that is, before seasonal adjustments — fell by 3,635 to 202,088 in the latest week. The number of people already collecting unemployment benefits in the week of May 10 rose by 36,000 to 1.9 million, the government said today.

Manufacturing & Services Indexes Up: U.S. business activity improved in May after a slump in the prior month, a pair of S&P surveys found and reported today. The flash U.S. manufacturing purchasing managers index (PMI) rose to a three-month high of 52.3 in May. The flash U.S. services PMI rose to a two-month high of 52.3 in May, from 50.8 in the prior month. Numbers above 50 signal growth in the economy. Activity accelerated from a 19-month low in April. Economists surveyed by the Wall Street Journal expected manufacturing to dip to 49.8 in May. They forecast the services PMI would inch down to 50.6 in the month.

CPI Tame: Consumer prices showed only a mild increase in April, but inflation probably won’t slow much further this year as the effects of the Trump trade wars ripple through the economy. The consumer-price index increased 0.2% last month, the Bureau of Labor Statistics said last Tuesday, matching Wall Street expectations. Prices had posted a rare decline in March. The 12-month increase in consumer prices dropped to 2.3% from 2.4% in a good sign. That’s the lowest level in four years. The April CPI report was compiled before most of President Donald Trump’s tariffs on China and the rest of the world were sharply increased, however.  “While annual CPI inflation slowed to 2.3 percent to April, this may be the low point in 2025,” said one economist.

PPI Down: Wholesale prices posted the biggest drop in April since the pandemic in 2020, but economists say the decline in inflation appeared to be a one-off that might not be sustained if tariffs persist at current levels. The producer price index (PPI) dropped 0.5% last month, the government said last Thursday, but the decline was largely tied to falling egg and gasoline prices and a quirky category that measures certain business profit margins. The rate of wholesale inflation in the past year, meanwhile, slowed to 2.4% from 3.4%. That’s the lowest level since last fall.

WEAK INDICATORS

LEI Down: The Conference Board’s Leading Economic Index (LEI) for the US Plunged in April. The LEI fell sharply by 1.0% in April 2025 to 99.4 , after declining by 0.8% in March (revised downward from the –0.7% originally reported). The LEI declined by 2.0% in the six-month period ending April 2025, the same rate of decline as over the previous six months (April–October 2024).

Industrial Production Down:  Industrial production was flat in April, the Federal Reserve reported last Thursday. This is the second straight weak report as uncertainty stemming from tariffs on goods imported to the U.S. starts to slow activity. The decline in April missed the consensus forecast for a 0.1% rise, according to a survey by the Wall Street Journal. Manufacturing alone slipped 0.4% in April, reversing a 0.4% gain in the prior month. Manufacturing makes up three-quarters of total production. Motor-vehicles and parts output fell 1.9% after a 1.4% rise in March, on the heels of a 10.1% jump in February. Excluding automobiles, manufacturing output fell 0.3%. Manufacturing of durables dropped 1.3% with declines across the board.

Retail sales Slows Down: Retail sales rose a scant 0.1% in April, the government said last Thursday, matching the Wall Street forecast. That’s a big comedown from a 1.7% spike in March that marked the biggest increase in more than two years. Auto sales fell slightly in April after new tariffs kicked in. Sales soared in March before anticipated price increases.

Import Inflation Up: Imported-goods costs showing signs of tariff-related price pressures. Import prices edged up 0.1% last month, the government said last Friday. Wall Street economists had forecast a 0.4% decline. However, excluding a drop in oil prices, import prices rose at a faster 0.4% pace, marking the biggest increase in a year. This minor economic report that typically draws little attention has taken on weight since U.S. President Donald Trump launched the biggest trade wars in decades.

Consumer Sentiment Down: Consumer sentiment falls for 5th straight month in May as inflation worries grow. The University of Michigan’s popular gauge of U.S. consumer sentiment released last Friday edged down to 50.8 in a preliminary May reading from 52.2 in the prior month. This is the index’s fifth straight monthly drop. Expectations for inflation spiked. Economists polled by the Wall Street Journal had expected sentiment would rise to 53.5. According to the report, a measure of consumer views on current conditions fell to 57.6 in May from 59.8 in the prior month, while a barometer of consumer expectations fell to 46.5 from 47.3. Year-ahead inflation expectations surged to 7.3% from 6.5% last month. Worries about higher prices have spiked from 2.6% in November. Overall, consumer sentiment was the second lowest in the history of the indicator (dating back to 1940). And, the inflation expectation gauge was the highest since 1981.

Small Business Optimism Down: The NFIB Small Business Optimism Index report last Tuesday declined by 1.6 points in April to 95.8, the second consecutive month below the 51-year average of 98. The Uncertainty Index decreased four points from March to 92 but remained far above the historical average of 68. Seasonally adjusted, 34% of business owners reported job openings they could not fill in April, down six points from March. The last time job openings were below this level was in January 2021.

Housing Starts Down: Construction of new homes — known as housing starts — rose a scant 1.6% to a 1.36 million annual pace in April, the government said last Frida. That’s how many houses would be built over an entire year if construction took place at the same rate in every month as it did in April. Just how weak is that? Housing starts are down 25% since they hit an annual rate of 1.83 million — an 18-year high — three years ago.

Call me if you have any questions. I am always happy to help!

John J. Gardner, CFP®, CPM®.

Blackhawk Wealth Advisors, Inc.

3860 Blackhawk Rd. Ste. 160 Danville, CA. 94506

Phone: 888-985-PLAN · Email: jg@blackhawkwealthadvisors.com

BLACKHAWKWEALTHADVISORS.COM

For my Market Monthly podcast, click on the link below. I provide a review of global stock market highlights over past month and preview of the month ahead. Forward insights and perspectives are based on current financial market and economic trends with an emphasis on relevant developments in various areas from Fed policy to company earnings announcements.

810c9060-6bc9-4e20-948f-60bee7c1b0be image
dc6d6594-dfce-48b0-8d69-3a27db12748d image
7d2eabf6-51c8-425f-b667-128ed7bc0dd2 image

Blackhawk Wealth Advisors is the parent corporation of Equity Research & Portfolio Evaluation and Blackhawk Asset Management. It’s Chief Investment Officer is John J. Gardner. John is a Certified Financial Planner (CFP®) and Certified Portfolio Manager (CPM®). As an AIF®, John is also an Accredited Investment Fiduciary.

CUSTOMIZED. STRATEGIC. DYNAMIC.