ERPE Excerpts 3.26.26 OIL

Bi-MONTHLY MARKET ANALYSIS &
ECONOMIC UPDATES
March 26, 2026
OIL
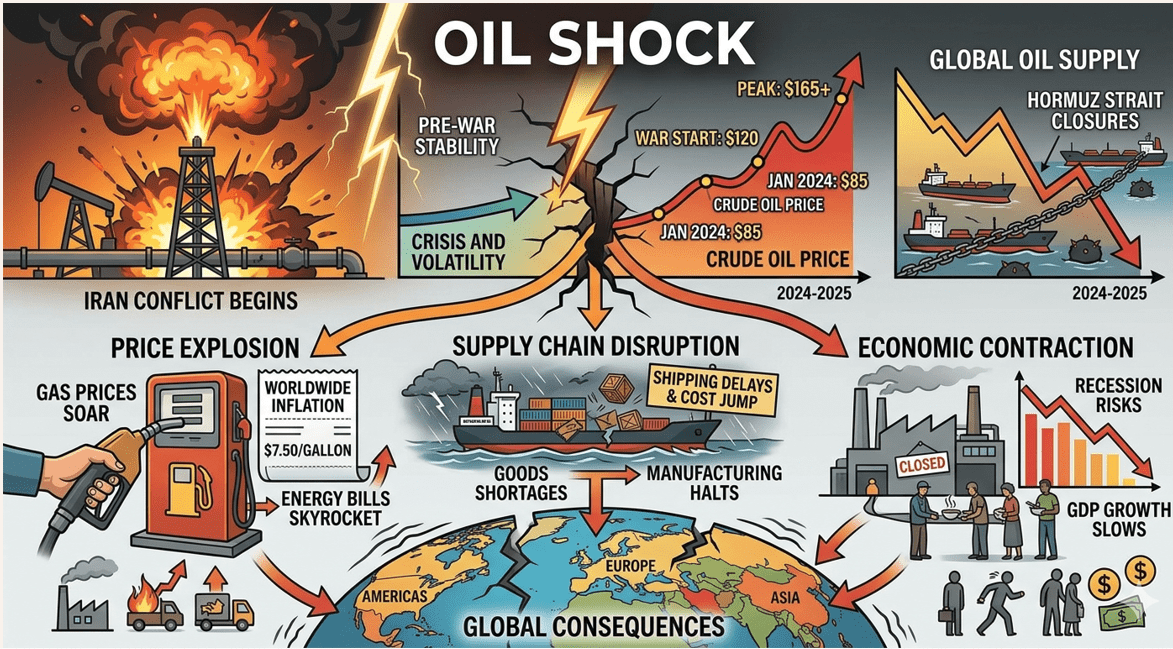
Since the first strike of Operation Epic Fury on February 28, there hasn’t been a single news cycle where oil didn’t command front-page real estate. The war with Iran has caused a global “energy shock”. Because the conflict isn’t just a regional border dispute—it’s a direct chokehold on 20% of the world’s petroleum and LNG—the price of crude has become the “scoreboard” for the war. Even on days when the military headlines were massive, oil remained the primary sub-headline or the “lead economic” story. In the eyes of the editors, the “Oil Story” is the only one that hits every single reader’s wallet, making it the most reliable headline since the war began.
First thing I read yesterday was a news article, “We are seeing a stronger open on Wall Street this morning, as oil prices are sliding on hopes of a truce between the U.S. and Iran. U.S. benchmark WTI crude is back below $90 a barrel.” When I picked the Wall Street Journal I saw the lead article, “Oil Supply Crunch is Spreading From Mideast to Rest of World.” The previous day it was, “Iran’s Strikes Are Costing Big Oil.” In evening news earlier this week “Peace Hopes” dominated the news with headlines such as “Markets Rally as Energy Supply Fears Recede.” I was surprised to not see “OIL” make the Journal’s front page headlines today, but there it was in the section on World News as the lead article, “A Global Energy Safety Net is Unraveling”. And so on, and so on…. On Wall Street it’s now all about oil. Here’s some perspective on the oil shock:
The economics of the war are expected to be high and long-lasting – having a direct effect on oil. Damage to oil-and-gas infrastructure in the Middle East caused by the war with Iran will take years and billions of dollars to repair, which would hamper efforts to fully restore production even if the conflict were to end soon. One analyst put a price tag on estimates to fix it at least $25 billion, and possibly more. It is expected that even after the Iran War ends, it will take months for Iran and its Middle East neighbors to return to their full pre-war oil production levels. Energy intelligence company Enverus forecasts international oil prices to average $95 in 2026 and $100 in 2027. Analysts estimate that more than six million barrels of oil production a day, and perhaps more, has already been shut in by Gulf countries.
The Strait of Hormuz is essentially closed as traffic is now down about 95% from pre-war levels. The effective closure of the Strait of Hormuz on March 4 has stranded approximately 20 million barrels per day (mb/d) of oil and petroleum products, representing roughly 20% of global consumption. Major Gulf producers (Saudi Arabia, UAE, Kuwait, and Iraq) have collectively cut production by an estimated 10 million barrels per day (mb/d) as of mid-March. This is largely due to the exhaustion of local storage capacity and the lack of viable alternative export routes. Fuel prices continue to be big concern as supply constraints persist. Chevron’s president of downstream said he is concerned about California’s fuel supply, suggesting that after a jump in prices, the next impact could be lack of available gas. Chevron CEO Mike Wirth states energy markets are underpricing the oil supply shock from the Iran war, with futures not reflecting physical impacts.
The macro supply/demand picture has been shocked. Prior to the conflict, Iran was producing roughly 3.5 mb/d of crude and exporting about 1.7 mb/d. In January 2026, the global market was comfortably supplied, with production at 106 mb/d slightly outpacing a demand of 104 mb/d. This “supply glut” initially tempered the war premium, but the total blockade of the Strait has since flipped the market into a structural deficit of 5–8 mb/d.
Oil prices climbing higher are a direct inflationary force. Costs rise in critical economic sectors from transportation to manufacturing and goods. Worst case is sustained high oil prices fuel “stagflationary” pressures, reducing consumer spending and potentially inducing recessions. Economists estimate that every $10 per barrel increase in oil adds 0.2% to inflation. Before the initiation of strikes on February 28, Brent crude was trading at approximately $66 per barrel. Since the onset of hostilities and the subsequent closure of the Strait of Hormuz, prices spiked to a peak near $120 before settling into a volatile range between about $90 and $115. So far in the U.S., gasoline prices have surged between 5 and 10 cents daily in some regions, with national averages rising from pre-war levels to over $4.00 per gallon — the highest since late 2023.
Restoring supply to keep prices stable may be difficult and will likely take time. It could take months to declare the waters fully safe for commercial tankers to move oil through the Strait. LNG facilities are particularly difficult to “cold start.” Even upon a diplomatic resolution, experts suggest it would take several weeks to reach pre-war delivery levels. In an emergency move, and the largest coordinated action in its 52-year history, the International Energy Agency (IEA) has authorized the release of over 400 million barrels from strategic reserves to bridge the gap, but at a maximum draw rate of roughly 4–6 mb/d, this only partially offsets the daily shortfall. The latest data on alternative bypass infrastructure confirms that while these routes are being pushed to their absolute mechanical limits, they can only replace a fraction of the 20 million barrels per day (mb/d) typically transiting the Strait of Hormuz. It is expected that even if every bypass pipeline in the Middle East operated at 100% efficiency, they could only handle about 45-50% of the volume lost from the Hormuz closure. This leaves a “homeless” volume of roughly 10–13 million barrels per day that simply cannot reach the market, regardless of production levels.
The consensus among major forecasting bodies as of yesterday is that the current oil price spike is a temporary, war-driven supply shock that will be followed by a gradual return to a lower-price environment (likely in the $60-$70 range) as markets adjust and supply increases elsewhere. If not, inflation concerns will become a larger threat and will likely spark more talk of “stagflation”. Such a high inflation + low economic growth condition would call for a defensive investment strategy.
Keep reading headlines. The oil story will be told for a while.

TAKING PERSPECTIVE…

Proper Perspective:  In our hectic and often hard to comprehend world, it is very easy to lose perspective. You may agree it is sometimes difficult to see the big picture. The media often doesn’t help with this, but unfortunately instead encourages us to see things in a most negative light. Here is hopefully a pause to gain positive perspective.
Famous Quote For Today:  “If a politician doesn’t want to get beat up, he shouldn’t run for office.”
~~ Bill Clinton, 2008
Today in History – On this day in 1979, Israel and Egypt sign peace deal with Egyptian President Anwar Sadat, Israeli Prime Minister Menachem Begin, and in the company of President Jimmy Carter.

MARKET ANALYSIS

INDICATORS OF INTEREST:
  • Market’s Current Signal: Uptrend Under Pressure.  Analysis of the stock market over 130 years of history shows we can view it in terms of three stages -market in uptrend, uptrend under pressure and market correction.  Since the 1880’s, this perspective has led to investment out-performance relative to market indexes. This is due to trend analysis which determines risk reducing, return enhancing market entry and exit points.
The U.S. stock market’s current signal indicates the market is in Uptrend Under Pressure. This trend change was triggered March 5 and ended the Confirmed Uptrend in place since last April 22. October 12, 2025 was the 3rd anniversary of this bull market. Recent weakness has yet to end the bull run.
Here are key market levels as of Monday, March 23:
Recapping Last Week
U.S. equity indices fell for a fourth straight week as the Iran war continued to roil energy markets and further clouded the outlook for inflation and interest rates. The spread between Brent crude—the global benchmark—and U.S.-based West Texas Intermediate crude widened to the largest gap in 11 years as the risk of Brent supply disruptions increased while releases from U.S. strategic reserves kept domestic prices relatively in check. WTI crude futures fell more than 1% to $97.95, while Brent futures jumped to over $119 before settling near $112, their highest level since the early months of Russia’s invasion of Ukraine. The Brent-WTI spread exceeded the high from that period. European natural gas prices surged nearly 30% after Iran attacked multiple energy facilities across the Middle East in response to Israel’s strike on its South Pars gas field. One piece of positive news emerged on Thursday when several European nations along with Japan expressed willingness to assist with safe passage for tankers through the Strait of Hormuz. The S&P500 and Nasdaq Composite indices fell 2% and the Russell 2000 lost 1.7%. Energy and financials were the only positive sectors last week, with the former now up more than 32% this year. U.S. Treasury yields continued to rise sharply, and precious metals tumbled after a hot inflation report and the Federal Reserve’s hawkish outlook. The Fed left rates unchanged while projecting higher inflation, steady employment, and only one rate cut for this year. Chair Powell said it was too soon to gauge the war’s effect on the economy but noted that the jump in oil prices has fueled rising inflation expectations in recent weeks. In economic reports, U.S. producer prices rose more than expected last month at a pace of 0.7% MoM and 3.4% YoY. Manufacturing activity was little changed in New York state while continuing to expand in the Philadelphia region. Delayed data revealed that new home sales in January plummeted more than 17% MoM to the slowest pace since 2022. More supply and less demand forced builders to lower prices, with the median sales price falling nearly 7% YoY to $400,500.
Overseas, Australia’s central bank raised rates for a second straight month in a tight 5-4 vote, citing material inflation risks. The Bank of Japan left rates unchanged but kept its options open for a rate hike in April. Central banks in Canada, Europe, and the UK also opted to keep rates steady, acknowledging the uncertain outlook for growth and inflation. Yields on British government gilts jumped to their highest level since 2008 as investors considered the possibility of rate hikes later this year. Traders are pricing in two or three rates hikes for Europe this year even as most economists still see no change. Finally, better-than-expected retail sales and industrial production figures gave China’s economy a kick start to begin the year.
Current View
The stock market rallied well early Wednesday on optimism over a potential truce with Iran. Today is the opposite. And, so it has been nearly every day – one step forward, one back, another forward then back. Daily – if not by the minute – the market is swinging from positive to negative as uncertainty mounts, guessing what the next “Truth Social” post will be, or what the president might say about negotiations with Iran. Finding firm ground to establish any conviction of market direction just is not possible. Away from the war and volatile energy prices, the market is placing a bullish bet on the upcoming earnings reports.
Yesterday marked the third day of a rally attempt for the Nasdaq and S&P 500 but is sustainability is highly questionable. Looks like the attempt will be thwarted today. This morning President Donald Trump warned Iran to “get serious soon” about a peace deal. Trump also weighed in on the surge in oil prices and investors’ reaction on the stock market. He said that the stock market’s reaction to the war and the surge in oil prices has not been as bad as he expected and he observed that oil is “going to come back down to where it was and probably lower.”
Here’s my 2026 OUTLOOK.
  • Industry Group Strength:  BEARISH. As of yesterday, 76 out the 197 groups I monitor are up year-to-date. 121 are down.
  • New Highs vs. New Lows: BEARISH.  In yesterday’s session, there were 89new 52-week highs and 77 new 52-week lows.
  • Dow Dividend Yield:  BEARISH. The current yield for the Dow Jones Industrial Average is 1.85%. The 10-year Treasury now 4.25%.
  • Volatility Index: BULLISH. Volatility has been volatile. The “VIX” is now 26. This is up from 18 two weeks ago. The index is also known as the “Fear Index.” It is considered a contrarian indicator and therefore viewed as bullish as it rises indicating investors are becoming more fearful. The VIX:
502fdd07-23bc-47a7-ad04-cc3b3f2387db image
  • Fear / Greed Index:  BULLISH.  Investors are driven by two emotions: fear and greed. Too much fear can create a condition of oversold/ undervalued stock prices. Too much greed can result in overbought/overvalued stock prices. The AAII Investor Sentiment Index is now neutral.   BE FEARFUL WHEN OTHERS ARE GREEDY. At 19, the Fear & Greed Index is down down 27 two weeks ago.
CLICK VIDEO FOR MORE ON THE “FEAR & GREED INDEX”
  • Bull / Bear Barometer:  BULLISH. This secondary market indicator should also be viewed with a contrarian perspective. As of yesterday, according to the latest survey of stock market newsletter writers by Investor’s Intelligence, the bullish tally is 39.3%, down from 49.1% two weeks ago. The bears are 25%, up from 21.8% two weeks ago. Consider this a contrarian indicator because the crowd is often wrong at market tops and bottoms. In other words, extreme bullishness has been seen near several market tops in the past, while extreme bearishness has been seen at market bottoms.
  • Put / Call Ratio: NEUTRAL. The ratio of put-to-call options is .95, up from 0.90 two weeks ago. The put-call ratio tracks the mood of what options investors are doing, not just saying. They typically buy puts if they think a stock will decline and calls if they think it will rise. If they’re buying lots of puts, they see the market declining. And if they’re loading up on calls, they’re generally bullish. Historically, market bottoms occurred when the reading spikes to 1.2 or more. Market tops are often made when the reading is 0.6 or less. Note how reliable this is with respect to the February record low coinciding with the market high. Keep in mind this is also a contrarian indicator.

ECONOMIC UPDATES

Global Economic Indicators & Analysis:
POSITIVE INDICATORS
Industrial Production Up: U.S. industrial production rose 0.2% in February 2026, marking a fourth consecutive monthly increase and exceeding the 0.1% forecasted growth, according to government report last Monday. Manufacturing output also grew by 0.2%, driven by a 1.6% jump in the auto sector and continued high-tech equipment manufacturing gains. Total industrial production is 1.4% higher than a year earlier.

WEAK INDICATORS

Jobless Claims Up: For the last week, U.S. initial jobless claims rose slightly to a seasonally adjusted 210,000, an increase of 5,000 from the previous week’s revised level of 205,000, according to the U.S. Department of Labor today. The data matched market expectations, signaling a stable labor market with relatively low layoffs. The continued low level of initial filings indicates that while the labor market is cooling, businesses are generally retaining staff.
Signs of inflation stacking up…
PPI Up: The Producer Price Index (PPI) for final demand in February 2026 increased by 0.7% on a monthly basis, exceeding expectations, with a 3.4% rise over the 12 months ending February 2026. The report was released by the Bureau of Labor Statics last Wednesday. This surge, the highest since February 2025, was driven by a 1.1% increase in goods prices and a 0.5% rise in services. The data highlights a acceleration in wholesale inflation, largely fueled by rising energy costs and goods prices, surpassing market expectations.
Import Prices Up: U.S. import prices jumped 1.3% in February 2026, the largest monthly increase since March 2022, driven by a 3.8% rise in fuel prices and broad increases in nonfuel goods. This surge exceeded expectations (0.5%–0.6% forecast), with annual import prices rising 1.3% over the past 12 months. The data, reported yesterday, indicates accelerating inflationary pressure from imported goods, with the 12-month change reaching its highest point since February 2025, as stated by the Bureau of Labor Statistics.
Call me if you have any questions.  I am always happy to help!
John J. Gardner, CFP®, CPM®.
Blackhawk Wealth Advisors, Inc.
Phone: 888-985-PLAN · Email: jg@blackhawkwealthadvisors.com