ERPE Excerpts 2.27.2025 … Soup, Soap & Cereal

Bi-MONTHLY MARKET ANALYSIS &

ECONOMIC UPDATES

February 27, 2025

Stock Market Defense

Soup, Soap & Cereal

As with some game plans, the best offense is a strong defense. In the stock market, the Consumer Staples sector is a defensive play. Back in the bear market of 2022, I wrote about “Soup, Soap and Cereal”. Since early in my career, I have referred to these economic elastic products and pillars of the stock market’s Consumer Staples sector as a proven defensive stock market investing strategy. After a Deja vu moment this week, I thought about revisiting this investment approach again. Click here to see my Soup, Soap & Cereal article from May 18, 2022.

Based on the notion that no matter how weak the stock market or economy may get, people will continue to eat, buy soap and consume goods that are always in demand. These stocks typically pay high dividends and are proven safe havens for investors in volatile markets and recessionary times. While we are not in weak economy now, as GDP data indicated this morning, the stock market has rapidly rolled over in recent days suggesting a correction is under way. As a stock market “growth scare” is sending large cap, highly valued, mostly tech stocks down – the consumer staples “defensive” stocks are climbing higher. For a quick snapshot example of that, see the graph below. Notice the stark outperformance of the Consumer Staples sector over one day (this Tuesday) and the last month compared to the Information Technology sector.

Further, and for a more specific view, see the chart below which displays the soup, soap, and cereal stocks (Campbells, Proctor & Gamble and General Mills) vs. the biggest tech growth stocks over just 5 trading days between February 19 and the 25th. This is indicative of the sudden, sharp decline in growth stocks and the market’s rotation to more defensive stocks.

Ultimately, offense is necessary to win a game. A strong offense is still crucial to consistently put points on the board and maintain a winning edge. As we have seen lately, though, a good defensive plan can result in a win.  Perhaps coach Bill Belichick said it best, “Defense wins championships, but you need to score points too.”

TAKING PERSPECTIVE…

Proper Perspective:  In our hectic and often hard to comprehend world, it is very easy to lose perspective. You may agree it is sometimes difficult to see the big picture. The media often doesn’t help with this, but unfortunately instead encourages us to see things in a most negative light. Here is hopefully a pause to gain positive perspective.

Famous Quote On This Day:  “I think Poetry should surprise by a fine excess and not by singularity”

~~ John Keats, 1818

What Happened On this Day February 27, 1902 – The American Automobile Association was founded.

MARKET ANALYSIS

INDICATORS OF INTEREST:

  • Market’s Current Signal: Market in Confirmed Uptrend.  Analysis of the stock market over 130 years of history shows we can view it in terms of three stages – market in uptrend, uptrend under pressure and market correction.  Since the 1880’s, this perspective has led to investment out-performance relative to market indexes. This is due to trend analysis which determines risk reducing, return enhancing market entry and exit points. The U.S. stock market’s current signal strengthened again on January 17th to Market in Confirmed Uptrend.

The Stock Market Trend: Uptrend Under Pressure.  Just days after the major market indexes closed at new all-time record highs on February 19, the market’s trend signal weakened from Confirmed Uptrend to Uptrend Under Pressure the 21st and reiterated on the 24th. The next weaker signal would be Market in Correction. That would be a 10% drop from the high made Wednesday the 19th. Already since then, the Nasdaq index has lost 6.5%.

Here are key market levels as of Monday, February 24.

Recapping Last Week

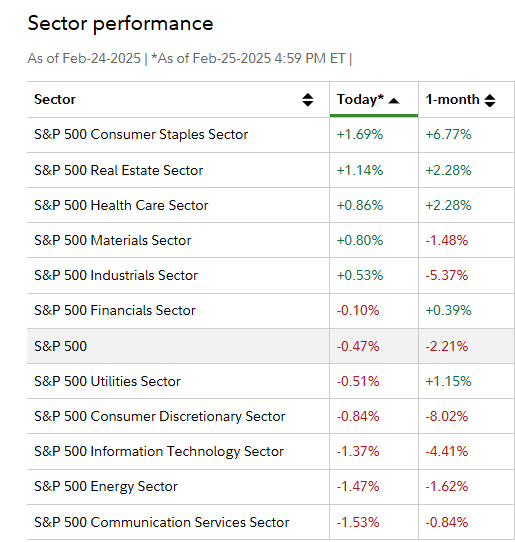
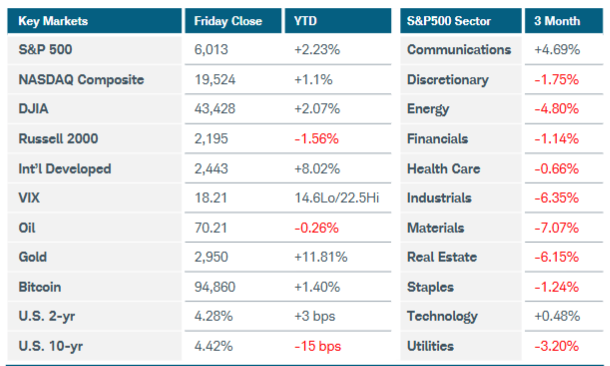
U.S. equity indices finished the week flat-to-lower as gains early faded into lingering inflation concerns to end the week. The S&P500 and Nasdaq Composite indexes fell 2%, while the small cap Russell 2000 lost 4%. Six out of eleven S&P500 sectors were negative on the week, while utilities and healthcare gained 1.5% and 1% respectively. Crude oil prices had another volatile week amid turmoil in Ukraine, yet finished mostly unchanged after reports of rising inventories caused a price pullback on Friday. Gold futures once again rose 2% to a new all-time high of $2973.40, edging ever closer to $3,000 per ounce. U.S. Treasury yields and the U.S. Dollar index both continued drifting lower, leaving the normal inverse correlation with equities at odds. Inflation and tariffs remain the main drivers of macro volatility. In Wednesday’s FOMC minutes, Federal Reserve officials seemed comfortable holding interest rates steady amid uncertain economic policies and slowing disinflationary trends. President Trump said he intends to impose tariffs “in the neighborhood of 25%” on automobiles and that he plans similar duties on semiconductors and pharmaceutical imports. Fed officials noted not only that these would lead to higher prices, but that the administration’s piecemeal approach is adding uncertainty about precisely which products would be affected. Headline U.S. PMI Index dropped to 50.4 from 52.7 in January, a 17-month low, and unemployment claims rose to 219,000, an increase of 5,000 from the week before. U.S. manufacturing data came in mixed as the Empire State Manufacturing Index popped to +5.7 in February from -12.6 in January, but the Philly Fed Index fell to 18.1 from 44.3 in January, the largest monthly drop in five years. The UofM Consumer Sentiment survey showed a 19% decline in buying conditions for durables, largely the result of fears of imminent tariff-induced price increases. Cost concerns are hitting the housing market as well, with the NAHB housing index dropping from 47 to 42. Existing home sales dropped 4.9% in January, though this level is still 2% higher than a year ago as prices increased for the 19th consecutive month. Housing starts slowed as builders pulled back amid concerns about mortgage rates and current inventory.

In international markets, Eurozone data is coming in more constructive, though inflation seems sticky in that region as well. UK CPI came in 3% higher in January vs 2.8% expectations, with some of that result coming from wages, as annual pay growth rose 5.9% from October to December. Retail sales rose by 1.7% as well. German PPI was 0.5% higher than a year ago, and their ZEW Economic Sentiment rose to 26, its strongest increase in two years. Australian and German PMIs were broadly expansionary yet showed a slight contraction in the UK. Australia’s unemployment rate ticked higher to 4.1% from 4%, and the RBA cut rates for the first time in four years while China left their rates alone. Inflation stayed front of mind in Canada and Japan, showing 1.9% and 4% increases respectively. This means headline inflation has been above Japan’s 2% target for 34 straight months. On the plus side, Japan’s economic expansion beat expectations in the fourth quarter when GDP grew 0.7% quarter-over-quarter vs 0.4% prior.

Current View

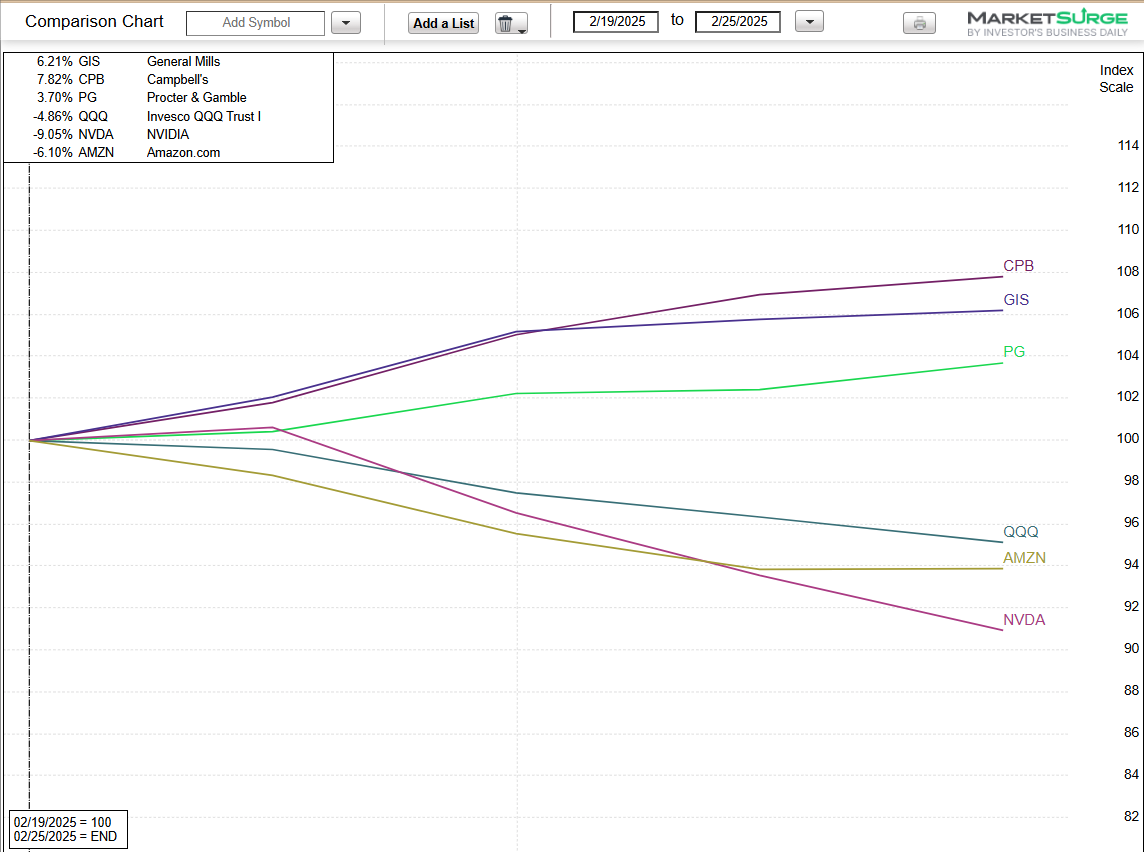
Early gains faded in the stock market Wednesday on more tariff talk, but Nasdaq 100 futures got a lift in after-hours trading when Nvidia (NVDA) delivered another strong earnings report. Strong opens and weak closes are typical in a weakening market, and that’s exactly what happened yesterday. After rising nearly 1.4% intraday, the Nasdaq composite closed with a gain of less than 0.3%. All eyes and ears on Wall Street were attentive to Nvidia’s earnings report after yesterday’s market close. After rising 3.7% during the regular session, Nvidia was up nearly 3% at one point in extended trading after reporting another quarter of strong bottom-line and top-line growth. Overnight that gain evaporated. This a another reminder of the stock markets extreme volatility lately.

The stock market started to weaken yesterday after 12:30 p.m. ET when President Donald Trump said that tariffs on European Union products would be 25% in general. He also said that tariffs on Canada and Mexico would take effect in early April. With increased volatility, investors may feel whipsawed. Tech stocks are especially displaying wild swings. Today, the Nasdaq reversed from an early-morning rise of nearly 0.9% to a loss of 1.4% at session lows. It would not be a surprise to see a positive close. That’s the type of volatile market we now have. The market’s trend signal is flashing Uptrend Under Pressure. The weaker signal would be Market in Correction.

  • Industry Group Strength:  BULLISH. As of yesterday, 138 out the 197 groups I monitor are up year-to-date. 59 groups are down for the year.
  • New Highs vs. New Lows:  BEARISH. In yesterday’s session, there were 87 new 52-week highs and 91 new 52-week lows.
  • Dow Dividend Yield:  BEARISH. The current yield for the Dow Jones Industrial Average is 1.73%. The 10-year Treasury now 4.27%.
  • Volatility Index: NEUTRAL. Volatility has been volatile. The “VIX” is now 19, up from 16 as two weeks ago. The index is also known as the “Fear Index.” It is considered a contrarian indicator and therefore viewed as bullish as it rises indicating investors are becoming more fearful. The VIX:
  • Fear / Greed Index:  BULLISH.  Investors are driven by two emotions: fear and greed. Too much fear can create a condition of oversold/ undervalued stock prices. Too much greed can result in overbought/overvalued stock prices. The AAII Investor Sentiment Index is now neutral.   BE FEARFUL WHEN OTHERS ARE GREEDY. At 22, the Fear & Greed Index is down from 44 two weeks ago.

CLICK VIDEO FOR MORE ON THE “FEAR & GREED INDEX”

How CNNMoney’s Fear & Greed Index works

  • Bull / Bear Barometer:  NEUTRAL. This secondary market indicator should also be viewed with a contrarian perspective. As of yesterday, according to the latest survey of stock market newsletter writers by Investor’s Intelligence, the bulls is 44.3% from 47.5% 2 weeks ago. The bears have dropped to 26.6%. The bearish read was 29.5% 2 weeks ago. Consider this a contrarian indicator because the crowd is often wrong at market tops and bottoms. In other words, extreme bullishness has been seen near several market tops in the past, while extreme bearishness has been seen at market bottoms.
  • Put / Call Ratio: BEARISH. The ratio of put-to-call options is 0.57, about the same as 2 weeks ago. The put-call ratio tracks the mood of what options investors are doing, not just saying. They typically buy puts if they think a stock will decline and calls if they think it will rise. If they’re buying lots of puts, they see the market declining. And if they’re loading up on calls, they’re generally bullish. Historically, market bottoms occurred when the reading spikes to 1.2 or more. Market tops are often made when the reading is 0.6 or less. Note how reliable this is with respect to the February record low coinciding with the market high. Keep in mind this is also a contrarian indicator.

ECONOMIC UPDATES

Global Economic Indicators & Analysis:

POSITIVE INDICATORS

Durable Goods Orders Up:  So-called core durable-goods orders climbed 0.8% last month, the government said today. These orders omit the military and transportation and are seen as a proxy for how much businesses are investing, a key source of economic growth. The key measure of business orders rose in January for the third month in a row.  Manufacturers were hoping to exit a two-year slump this year in anticipation of tax cuts and deregulation under President Trump, but his ever-present threat of tariffs has put them on pause.

Empire State Index Up:  Business activity edged higher in New York State in February, according to firms responding to the Empire State Manufacturing Survey. The headline general business conditions index climbed eighteen points to 5.7. New orders and shipments grew moderately. Delivery times were slightly longer and supply availability was slightly lower. Inventories continued to expand modestly while employment levels moved lower. Input prices increased at the fastest pace in nearly two years, and selling price increases also ticked up noticeably. Though firms expect conditions to improve over the next six months, optimism about the outlook dropped significantly.

WEAK INDICATORS

Jobless Claims Up: The number of people who applied for unemployment benefits last week matched a three-month high, possibly reflecting the first wave of what’s likely to be a flood of laid-off federal employees and private contractors filing new claims. New jobless claims jumped by 22,000 to 242,000 in the last week, the government said today. This is up from 220,000 in the prior week. The layoffs of tens of thousands of federal workers and the additional job losses among private entities that get government funding are likely to swell total jobless claims for a few months.

LEI Down:  The Leading Economic Index for the US fell by 0.3% in January 2025 to 101.5 , after a 0.1% increase in December 2024 (upwardly revised from an initially estimated decline of 0.1%). Overall, the LEI recorded a 0.9% decline in the six-month period ending January 2025, much less than its 1.7% decline over the previous six months. On a positive note, the Conference Board’s LEI release also included a forecast that real GDP for the US will expand by 2.3% in 2025, with stronger growth in the first half of the year.

Consumer Confidence Down: A postelection high in consumer confidence after Donald Trump’s victory has faded, as the public digests major upheavals in U.S. economic policies such as trade and tariffs. The index of consumer confidence dropped 7.0 points in February to an eight-month low of 98.3, the privately run Conference Board said Tuesday. The decline was the third in a row since the index hit a 16-month peak of 112.8 in November. Economists polled by the Wall Street Journal had forecast the index to register 102.4, compared with a revised 105.3 in the prior month.

Consumer Sentiment Down: The second of two readings of consumer sentiment in February slipped to 64.7 from 67.8 earlier in the month, the University of Michigan said last Friday. It’s the lowest level since November 2023. Sentiment has fallen nearly 10% from January. According to the report, Americans’ expectations for overall inflation over the next five to 10 years rose to 3.5% from 3.3% earlier in the month and from 3.2% in January. This is the largest month-over-month increase since May 2021.

Existing Home Sales Down: Home sales fell in the first month of the year as buyers continued to struggle with high home prices and 7% mortgage rates. Home sales fell 4.9% in January to a 4.08 million pace. That’s the number of homes that would be sold over an entire year if sales took place at the same rate in every month as they did in December. The numbers are seasonally adjusted. The median home price for the month was the highest on record, at $396,900, according to the National Association of Realtors, which released the data.

Pending Home Sales Down: Today the National Association of Realtors reported pending home sales in January dropped 4.6%. Compared to one month ago, pending home sales retreated in the Midwest, South and West, while the Northeast underwent a slight increase. Year-over-year, contract signings declined in all four U.S. regions, with the South showing the largest reduction. Housing affordability suffered in January as mortgage rates ranged from 6.91% to 7.04%. Compared to one year ago, the monthly mortgage payment on a $300,000 home increased by an extra $50 to $1,590.

Call me if you have any questions. I am always happy to help!

John J. Gardner, CFP®, CPM®.

Blackhawk Wealth Advisors, Inc.

3860 Blackhawk Rd. Ste. 160 Danville, CA. 94506

Phone: 888-985-PLAN · Email: jg@blackhawkwealthadvisors.com

BLACKHAWKWEALTHADVISORS.COM

For my Market Monthly podcast, click on the link below. I provide a review of global stock market highlights over past month and preview of the month ahead. Forward insights and perspectives are based on current financial market and economic trends with an emphasis on relevant developments in various areas from Fed policy to company earnings announcements.

810c9060-6bc9-4e20-948f-60bee7c1b0be image
dc6d6594-dfce-48b0-8d69-3a27db12748d image
7d2eabf6-51c8-425f-b667-128ed7bc0dd2 image

Blackhawk Wealth Advisors is the parent corporation of Equity Research & Portfolio Evaluation and Blackhawk Asset Management. It’s Chief Investment Officer is John J. Gardner. John is a Certified Financial Planner (CFP®) and Certified Portfolio Manager (CPM®). As an AIF®, John is also an Accredited Investment Fiduciary.

CUSTOMIZED. STRATEGIC. DYNAMIC.