ERPE Excerpts 12.11.2025 2026 Themes & Perspective

Bi-MONTHLY MARKET ANALYSIS &

ECONOMIC UPDATES

December 11, 2025

2026:

Themes & Perspective

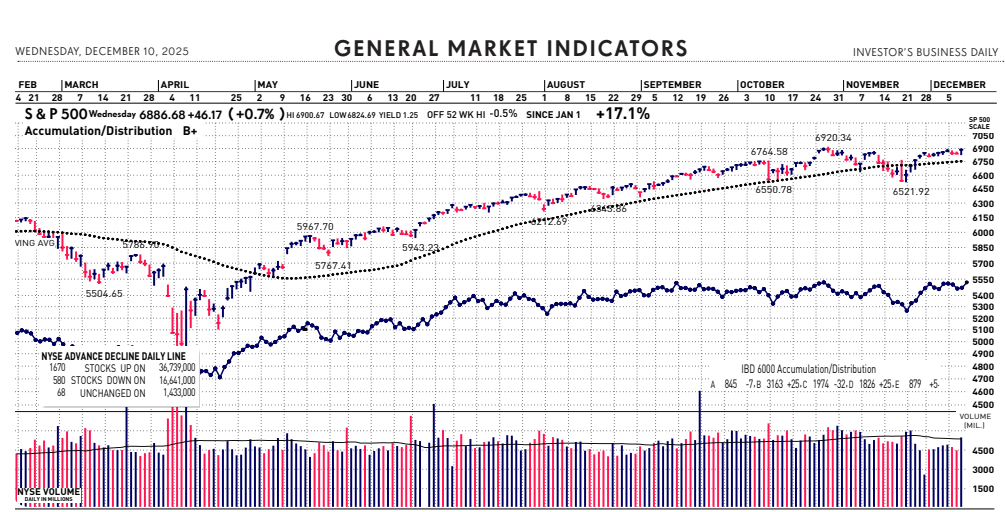
As we look forward to 2026, it’s worth reflecting back on the remarkable period we’ve just experienced. For the sixth time in seven years, the stock market has delivered double-digit returns, even though it hasn’t always felt smooth (this February, March and April are a great reminder of that). This has put many investors in a strong financial position, creating opportunities to make progress toward long-term goals.

What should we expect in the year ahead? While no one can predict the future with certainty, understanding the key themes shaping markets can help us maintain perspective and make informed decisions together.

2026 Outlook: Seven Key Themes for Long-Term Investors

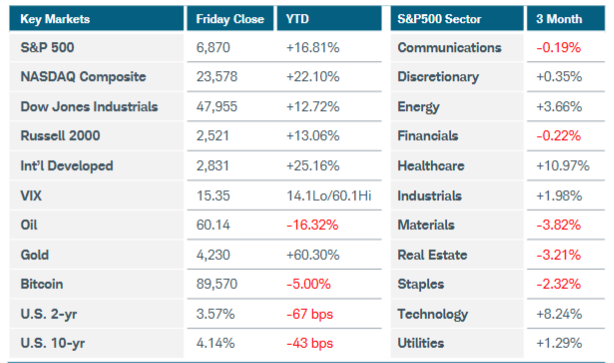
1. Diversification is working again: For much of the past decade, U.S. stocks outperformed nearly everything else. That changed in 2025 as international stocks and bonds both contributed meaningfully to portfolio returns. Periods like the February through April stock market volatility remind us that a balanced approach can help smooth the journey toward your goals.

2. Stock valuations are elevated: Strong market returns have pushed stock prices higher relative to company earnings. The S&P 500 now trades at levels approaching those seen during the dot-com era, and we should be prepared for volatility as markets adjust to higher valuations. This simply means that investors need to be more thoughtful and selective when considering what a proper asset allocation looks like.

3. Artificial intelligence continues to drive growth: AI has captured enormous attention and investment. Companies are spending trillions building the infrastructure needed to support this technology. While AI will undoubtedly transform our economy, the key question is whether current stock prices already reflect this future growth. Since most portfolios have significant exposure to AI-related companies through major stock indices, maintaining appropriate balance remains essential.

4. Economic growth remains positive but uneven: The economy continues to grow at a healthy pace, though not everyone is experiencing this equally. Some sectors and income groups are thriving, while others face challenges. This is sometimes referred to as a “two-speed” or “K-shaped” economy. For investors, it’s important to separate what affects the overall market and how this might differ from our daily experiences.

5. Tariff concerns may continue: Despite significant attention in 2025, tariffs have not caused the economic disruption many feared. Inflation has remained relatively stable, and growth has continued. This doesn’t mean tariffs are unimportant, but it suggests that their effects may be more nuanced than headlines suggest. The key lesson is that we should not react to every policy announcement.

6. Political developments will create headlines: The upcoming midterm election, ongoing discussions about government debt, and the new One Big Beautiful Bill Act (OBBBA) tax legislation will all generate news throughout the year. While these topics matter for policy and planning, history shows that markets have performed well across different political environments. What we can control is ensuring your financial plan takes advantage of new tax rules. Now is a great time to check your plan!

7. The Federal Reserve will continue supporting the economy: With new leadership coming to the Fed in mid-2026, monetary policy will likely evolve. However, history shows that the economy has grown across different Fed chairs nominated by both political parties. Sticking to long-term financial goals, not over-reacting to monetary policy changes, is key.

Maintaining Perspective in 2026

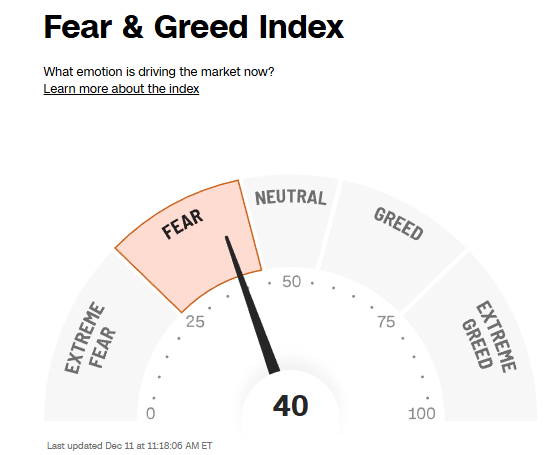
Perhaps the most important lesson from recent years is that what investors fear most often doesn’t come to pass. This doesn’t mean we should ignore risks. Elevated valuations, slower global growth expectations, and various uncertainties all deserve continued attention. It is how we manage these risks but still move forward that really matters. I have always believed it is not what happens to us in life – but how we handle it, that matters.

The challenge for long-term investors isn’t predicting which specific events will matter most. Instead, it’s maintaining a balanced, diversified portfolio positioned to weather various outcomes while capturing long-term growth. After all, markets don’t move in straight lines.

In summary, markets have delivered strong performance, but the key to 2026 will continue to be maintaining a risk-aware portfolio aligned with your goals. As always, I’m here to help my clients navigate the year ahead and keep their financial plan on track.

What events might impact markets in 2026?

History shows that each year comes with new surprises that are often hard to predict. As we look ahead to 2026, several key factors could shape markets and the economy:

• Unlike much of the past decade when U.S. stocks dominated, many different asset classes are now contributing meaningfully to portfolio returns. International stocks have outpaced U.S. markets in 2025, with developed and emerging market stocks each gaining around 30%. Fixed income has also played its stabilizing role, with bonds also delivering positive outcomes for investors.

• The upcoming midterm election could have implications for tariffs, regulation, and government spending. Historically, midterm election years have delivered healthy market returns, with the S&P 500 averaging 8.6% since 1933. While political uncertainty may create short-term volatility, markets have historically looked past election cycles and focused on underlying economic fundamentals.

• Artificial intelligence remains a driving force shaping both the economy and markets. While this creates opportunities, it also means many portfolios have significant exposure to technology companies through major indices. The key is ensuring your portfolio remains appropriately balanced for your goals rather than becoming overly concentrated in any single theme.

The most important consideration isn’t predicting which of these factors will matter most, but ensuring your portfolio is positioned to weather uncertainty while capturing long-term growth. As I often say, the right question is not, “How is the market doing?” It is, “How is your plan doing?”.

This commentary is prepared for informational and educational purposes only and is not intended to provide financial, accounting, tax, or legal advice. It should not be used as the sole basis for any investment decision.

TAKING PERSPECTIVE…

Proper Perspective:  In our hectic and often hard to comprehend world, it is very easy to lose perspective. You may agree it is sometimes difficult to see the big picture. The media often doesn’t help with this, but unfortunately instead encourages us to see things in a negative way. Here is hopefully a pause to gain positive perspective.

Famous Quote On This Day:   “Even if a mother could forget her child- I will not forget you -”

~~ Mother Teresa, 1979

What Happened On this Day December 11, 1941: – Germany and Italy declare war on US.

MARKET ANALYSIS

INDICATORS OF INTEREST:

  • Market’s Current Signal: Confirmed Uptrend.  Analysis of the stock market over 130 years of history shows we can view it in terms of three stages -market in uptrend, uptrend under pressure and market correction.  Since the 1880’s, this perspective has led to investment out-performance relative to market indexes. This is due to trend analysis which determines risk reducing, return enhancing market entry and exit points. The U.S. stock market’s current signal indicates the market is in Confirmed Uptrend. That officially happened April 22 and is still intact. This has been the fastest market rebound from a bear market low in history. The uptrend is remains. October 12 was the 3rd anniversary of this bull market.

The Stock Market Trend: Confirmed Uptrend. The stock market powered higher Tuesday, April 22 and the Nasdaq and S&P 500 confirmed new rally attempts. That follow-through signaled a Confirmed Uptrend. In late June the major stock market indexes reclaimed levels set in late February and significantly above the pre-“Liberation Day” level. Until late October, the major indexes were making new all-time record highs. October 28 was the 36th new high of 2025 for the SP 500. Volatility has spiked in the U.S. equity market since with a trend breaker session on November 20. As is the new norm, the BTD (buy the dip) behavior resulted in a reversion back to a bullish trend in the ensuing days. Yesterday’s positive market reaction to the FOMC action and Fed chair Powell’s comments took some indexes to all time record highs.

Here are key market levels as of Monday, December 8:

Recapping Last Week

U.S. equity indices posted modest gains as investors’ expectations for an interest rate cut this month continued to rise. The Nasdaq Composite and Russell 2000 indices each rose nearly 1%, while the S&P500 added 0.3%. Sector performance was mixed, with gains in technology (+2.4%) and energy (+1.5%) offsetting pullbacks in utilities (-4.5%) and healthcare (-2.8%). Crude oil prices jumped 2.8% after OPEC agreed to leave output levels unchanged for the first quarter of 2026, but the move wasn’t enough to reverse the technical downtrend that has continued for the second half of this year. Gold and cryptocurrencies were down slightly for the week. U.S. Treasury yields rose despite employment and inflation data that strengthened the case for the Federal Reserve to lower rates this month. Bond traders may have been wary of a surge in new monthly U.S. corporate debt issuance, while the prospect of Japan raising rates later this month could renew volatility concerns over the carry trade unwind. The U.S. labor market remained a mixed picture, as private payroll data was soft, yet weekly jobless claims reached a three-year low. The ADP employment report showed a surprise loss of 32,000 jobs in November. However, historically that estimate has diverged from official government data, which won’t be released until December 16. The Chicago Fed estimated that the U.S. unemployment rate was unchanged in November at 4.4%, though that figure may rise given the elevated level of continuing jobless claims. There was positive news on the inflation front, as September’s long delayed core PCE price index was lower than expected at 0.2% MoM and 2.8% YoY. Consumer sentiment rose for the first time in five months, reflecting improved inflation expectations and more optimism in the outlook for personal finances. Americans now see one-year inflation at 4.1% and 3.2% annualized for the next five to ten years, the lowest levels since January. In other economic news, consumer spending on Black Friday was seen as eclipsing last year’s results, driven by a 9% surge in online shopping. U.S. manufacturing activity shrank again in November, with the ISM PMI index remaining in contraction territory for a ninth straight month. Services PMI was little changed at 52.6, with employment subdued and prices for inputs elevated.

Overseas, China’s government and private sector PMI surveys both slipped into contraction as lackluster domestic demand persisted. Britain’s central bank announced initiatives to ease capital requirements for lenders in an effort to stimulate the economy, the first such reductions since the global financial crisis. Finally, the Bank of Japan offered its strongest hint yet that a rate hike is in the offing, causing money markets to raise the odds of a move on December 19 to near 80%.

Current View

Investors like me in the stock market in the 1980s, likely remember that iconic Wall Street slogan: “When E.F. Hutton talks, people listen.” In the first half of the 2020s, substitute “E.F. Hutton” in that sentence with the name Jerome Powell. All investors’ eyes and ears yesterday focused on the chair of the Federal Reserve and fellow governors at America’s central bank. Investors cheered what they heard and boosted the stock market to near-all-time highs.

The Federal Open Market Committee’s statement was historic in some respects. First, it said that for the first time since September 2019 that at least three members of the interest-rate policy committee voted against the move to cut the fed funds rate by 25 basis points. Second, the Fed said that beginning today, it would boost holdings of Treasury bills “and, if needed, other Treasury (debt) securities with remaining maturities of 3 years or less to maintain an ample level of reserves.” Such a move, the thinking goes, helps maintain a high level of liquidity within the U.S. financial system.

Do rate cuts matter? I think so. At the peak of the Fed’s monetary tightening campaign on July 26, 2023, when the lending rate for overnight cash infusions into large banks went up by a quarter point to a 5.25%-5.5% range, the S&P 500 was at 4,566. Yesterday, the S&P 500 rose nearly 0.7% to 6,886. That’s a 50.8% gain over that time frame spanning two years and nearly five months, excluding dividends. This is just one piece of evidence — amid decades of stock market history — declaring that stocks tend to thrive when the cost of debt goes down. The market’s great debate now is whether or not the Fed will cut rates more next year.

Long-term analysis shows that over 22 U.S. rate-cutting cycles since 1928, US stocks averaged an 11% return above inflation in the year after cuts began. That could bode well for 2026.

  • Industry Group Strength:  BULLISH. As of yesterday, 164 out the 197 groups I monitor are up year-to-date. 33 groups are down for the year.
  • New Highs vs. New Lows:  BULLISH. In yesterday’s session, there were 463  new 52-week highs and 62 new 52-week lows.
  • Dow Dividend Yield:  BEARISH. The current yield for the Dow Jones Industrial Average is 1.80%. The 10-year Treasury now 4.12%.
  • Volatility Index: NEUTRAL. Volatility has been volatile. The “VIX” is now 16, down from 20 two weeks ago. The index is also known as the “Fear Index.” It is considered a contrarian indicator and therefore viewed as bullish as it rises indicating investors are becoming more fearful. The VIX:
502fdd07-23bc-47a7-ad04-cc3b3f2387db image
  • Fear / Greed Index: BULLISH.  Investors are driven by two emotions: fear and greed. Too much fear can create a condition of oversold/ undervalued stock prices. Too much greed can result in overbought/overvalued stock prices. The AAII Investor Sentiment Index is now neutral.   BE FEARFUL WHEN OTHERS ARE GREEDY. At 40, the Fear & Greed Index is up from 24 two weeks ago.

CLICK VIDEO FOR MORE ON THE “FEAR & GREED INDEX”

How CNNMoney’s Fear & Greed Index works

  • Bull / Bear Barometer:  BEARISH. This secondary market indicator should also be viewed with a contrarian perspective. As of yesterday, according to the latest survey of stock market newsletter writers by Investor’s Intelligence, the bullish tally is 53.6%, down from 59.3% two weeks ago. The bears are 147.8%, up from 14.8% two weeks ago. Consider this a contrarian indicator because the crowd is often wrong at market tops and bottoms. In other words, extreme bullishness has been seen near several market tops in the past, while extreme bearishness has been seen at market bottoms.
  • Put / Call Ratio: BEARISH. The ratio of put-to-call options is 0.69, down from 0.76 two weeks ago. The put-call ratio tracks the mood of what options investors are doing, not just saying. They typically buy puts if they think a stock will decline and calls if they think it will rise. If they’re buying lots of puts, they see the market declining. And if they’re loading up on calls, they’re generally bullish. Historically, market bottoms occurred when the reading spikes to 1.2 or more. Market tops are often made when the reading is 0.6 or less. Note how reliable this is with respect to the February record low coinciding with the market high. Keep in mind this is also a contrarian indicator.

ECONOMIC UPDATES

Global Economic Indicators & Analysis:

Government Shutdown Ended

From October 1, 2025 to November 12, 2025, the federal government of the United States was in a shutdown as Congress failed to pass appropriations legislation for the 2026 fiscal year. The 43-day shutdown was the longest in U.S. government history.

POSITIVE INDICATORS

ISM Services PMI (Nov 2025)52.6 (vs. 52.4 prior)Service Sector Up – barely: The dominant service sector unexpectedly held its ground, with the PMI edging up to $52.6. Consumers are still spending on services, providing a crucial counter-weight to the industrial slowdown.

ISM Services Prices Index (Nov 2025)65.4 (down from 70.0)Inflationary Pressures Easing: One of the few bright spots on inflation, the price index component of the Services PMI dropped sharply. This signals that rising labor and input costs are finally decelerating in the non-manufacturing sector. This is a month-over-month change.

Personal Income (Sept 2025, delayed)+0.4% Consumer Wallet Resilient: Despite the gloomy labor headlines, personal income rose a solid 0.4%, indicating that households are entering the holiday season with strong, though diminishing, reserves.

PCE Price Index (Core) (Sept 2025, delayed)+0.2% Core Inflation Up Slightly: The Fed’s preferred inflation gauge, core PCE, showed a modest monthly gain of 0.2%, offering a small sign that the central bank’s actions are containing underlying price pressures.

WEAK INDICATORS

ADP National Employment Report (Nov 2025)-32,000 Jobs (Private Sector)The Labor Market Cracks: This report confirmed the long-feared slowdown, showing the private sector shed $32,000 jobs in November. A cooling labor market is now officially running cold.

ISM Manufacturing PMI (Nov 2025)48.2 (down from 48.7)Industrial Recession Deepens: Manufacturing contracted for the ninth straight month, slipping to $48.2. The industrial sector remains trapped in a persistent downturn, fueled by soft global demand and trade uncertainty.

ISM Manufacturing New Orders (Nov 2025)47.4 (down from 49.4)Demand Falls Off a Cliff: The forward-looking New Orders index in manufacturing plummeted by 2 points, signaling that companies see little reason to ramp up production in the coming months.

ISM Services Employment Index (Nov 2025)48.9 (Contracting)Service Jobs Slowing: While the headline Services PMI was positive, the employment component contracted for the sixth straight month. The engine of the economy is still running, but it’s hiring fewer people to do the work.

Call me if you have any questions. I am always happy to help!

John J. Gardner, CFP®, CPM®.AIF®

Blackhawk Wealth Advisors, Inc.

3860 Blackhawk Rd, Ste. 160 Danville, CA. 94506

Phone: 888-985-PLAN · Email: jg@blackhawkwealthadvisors.com

BLACKHAWKWEALTHADVISORS.COM

For my Quarterly Market Focus podcast, click on the link below. I provide a review of global stock market highlights over past quarter and preview of the quarter ahead. Forward insights and perspectives are based on current financial market and economic trends with an emphasis on relevant developments in various areas from Fed policy to company earnings announcements.

LinkedIn
810c9060-6bc9-4e20-948f-60bee7c1b0be image
dc6d6594-dfce-48b0-8d69-3a27db12748d image
7d2eabf6-51c8-425f-b667-128ed7bc0dd2 image

Blackhawk Wealth Advisors is the parent corporation of Equity Research & Portfolio Evaluation and Blackhawk Asset Management. It’s Chief Investment Officer is John J. Gardner. John is a Certified Financial Planner (CFP®) and Certified Portfolio Manager (CPM®). As an AIF®, John is also an Accredited Investment Fiduciary.

CUSTOMIZED. STRATEGIC. DYNAMIC.