ERPE Excerpts 1.16.2025 2024 Review… perspective on index returns

Bi-MONTHLY MARKET ANALYSIS &

ECONOMIC UPDATES

January 16, 2025

2024 Review:

Perspective on Index Returns

The 2024 U.S. stock market was a year of records. Mosttly, these were record setting new highs. It seemed at times as if the primary market index, SP 500, made a new all-time closing high almost daily. Not quite. But the SP 500 nearly set a market record for the most new record closing highs last year – 57. It climbed above 6,000 for the first time. Other 2024 record highlights were milestones such as the Nasdaq index topping 20,000 and the Dow Jones surpassing 45,000. The Dow also nearly broke a less auspicious record last year. It declined 10 days in a row, which had not occurred since 1974. Another not-so-good record set last year in stock land was the by the Russell 2000. It is known as the small cap index. It fell the most in a single day in its history on December 18. Beyond the stock market, gold and bitcoin broke all-time high prices. Bitcoin caught all the attention as it jumped over $100,000 for the first time.

A popular Wall Street barometer is known as the Santa Claus Rally. It is the period covering the last 5 trading days of a year and the first 2 of the new year. Going back to 1950 the market has performed well over the period — up on average 1.3%. The Grinch spoiled it this year. The SP 500 had a rough December as it lost 2.5%. However, 2024 was a strong year for the stock market. And it followed the bull run of 2023. In fact, last year was only the 7th time since 1950 of back-to-back gains for the SP 500 greater than 20%. The performance graphs below represent an “asset allocation quilt”. The SP 500 is represented by “Large Cap”. Notice the last 2 years. Also, by zooming out with a wider view we can see the benefits of diversification. More on that below…

Now, for perspective’s sake, look at the previous 10 years…

Of the many investment lessons learned from the graphs above, one is the risk reduction benefit of diversification. Unlike the last two years, the same investment asset class is rarely the back-to-back best performer. Besides the SP 500 gaining greater than 20% in 2024 as it did in 2023, there is another noteworthy similarity in the stock index over the two years. In a word: narrow. As I wrote my mid-year market commentary for our “Half Time Review”, I was reminded of the same time 2023. With 2024 in the history books, reviewing the full year’s action looks a lot like full year 2023.  The evidence of a narrow market exists in both years. The concept of a narrow market is the opposite of a broad market and speaks to the participation of stocks advancing and contributing to the overall market gain. At mid-year 2024, the concentration of the S&P 500 is at its highest level in over 30 years, with the top 10 stocks representing about 37% of the index. Of those 10 stocks, 7 are known as the “Magnificent Seven”. They are also referred to as mega-cap tech growth stocks. These stocks boosted the Nasdaq stock index, which more than doubled the gain of the Dow (see the charts below). Those “Mag 7” stocks accounted for more than half (53%) of the S&P 500’s total return in 2024. If you subtract those seven stock returns from the S&P 500, the index’s 2024 total return would shrink to 11.75%.

Looking ahead to 2025, two expectations come to mind: more volatility and less interest cuts. 2024’s stock market was an anomaly in that it did not have a correction. This is defined as a drop of 10% or more. Corrections normally occur once a year and sometimes more. Expect more volatility this year, which will likely include a correction. I expect “one or none” rate cuts by the Fed this year. The good news is that the economy is strong. The bad news is that often in the stock market good news is bad news. That circles back to increased volatility.

Happy and Health 2025!

TAKING PERSPECTIVE

Proper Perspective:  In our hectic and often hard to comprehend world, it is very easy to lose perspective. You may agree it is sometimes difficult to see the big picture. The media often doesn’t help with this, but unfortunately instead encourages us to see things in a most negative light. Here is hopefully a pause to gain positive perspective.

Famous Quote on This Day:

“The enhanced role of money in the re-election process has produced an atmosphere conducive to pervasive institutionalized corruption.”

~~ Al Gore, 2006

What Happened On This Day January 16, 1944 – Eisenhower takes command of the allied invasion force in London.

MARKET ANALYSIS

INDICATORS OF INTEREST:

  • Market’s Current Signal: Market uptrend under pressure.  Analysis of the stock market over 130 years of history shows we can view it in terms of three stages – market in uptrend, uptrend under pressure and market correction. I analogize this to a traffic signal’s changing colors from green to yellow and then to red. The current signal is still green. Since the 1880’s, this perspective has led to investment out-performance relative to market indexes. This is due to trend analysis which determines risk reducing, return enhancing market entry and exit points.

The Stock Market Trend: Uptrend under pressure.  Minus a Santa Rally, the U.S. stock market is off to a good start in 2025, though December’s weakness triggered a change in the market’s trend. This reflects a cautionary view. While yesterday’s strong, broad based gains were bullish, the mounting distribution days since mid-December are a concern.

Here are key market levels as of Monday, January 13.

Recapping Last Week

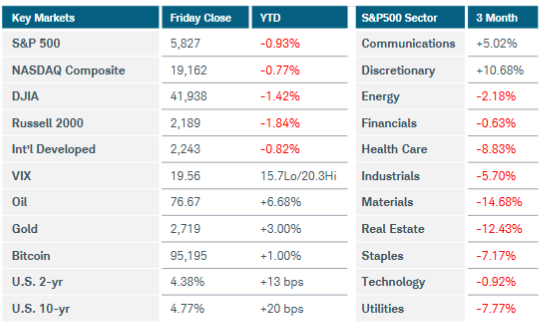
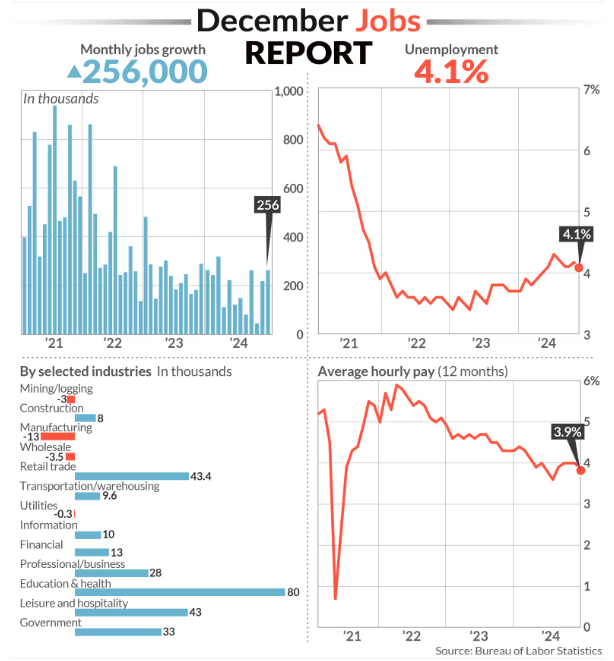
Stronger-than-expected economic data moved the goalposts for rate cuts this year, sending Treasury yields sharply higher and U.S. equity indices lower in a shortened trading week. The S&P500 index slid nearly 2%, while the Nasdaq Composite fell 2.3% and the Russell 2000 slumped 3.5%. Eight of eleven S&P500 sectors ended lower, with technology dropping 3% and real estate tumbling 4%. The energy sector was boosted by crude oil prices, which jumped more than 3.5% last Friday after the U.S. announced additional sanctions on the Russian oil industry, threatening supply constraints. U.S. Treasury yields spiked across the curve after December’s job growth came in much higher than forecasted. The 30-year bond yield surpassed 5% for the first time since October 2023 before retreating modestly. Non-farm payrolls expanded by 256,000 versus expectations for 155,000, while the unemployment rate edged down to 4.1% and the “under-employment” rate fell to 7.5% from 7.7%. Wage gains were muted—good news on the inflation front—but the overall stronger picture of the U.S. labor market caused traders to adjust their interest rate-cut assumptions. Fed funds futures aren’t pricing in more than a 50% chance of a cut until June, and sentiment has shifted to reflect only one potential cut this year, although it’s early and much can change. Other economic data supported the notion that the Fed’s easing policy may slow more than initially thought. Preliminary U.S. consumer sentiment for January slid to 73.2 as long-term inflation expectations jumped to 3.3% annualized, up from 3% just a month ago. ISM services PMI rose to 54.1 in December and the prices paid index leapt more than six points to 64.4, suggesting sharply higher costs for materials and services.

On the international front, China’s central bank outlined its 2025 priorities to promote a stable economy. Although the bank said it would implement moderately loose monetary policy to support growth, regulators sought to reassure investors last week as the country’s equity and currency markets extended losses. China’s stock exchanges asked some large mutual funds to restrict stock selling, while the central bank announced it will suspend buying government bonds as yields sank to all-time lows. Inflation in China remained subdued last month, raising the specter of deflation. Canadian Prime Minister Justin Trudeau said he would step down as leader of the ruling Liberal party but will stay in his post until a replacement is chosen, most likely in May at the earliest. European stocks and the euro initially rallied after some reports suggested that the potential U.S. tariff plan may not affect the region as extremely as feared. The gains were quickly reversed, however, in large part due to the U.S. dollar’s relentless advance. Eurozone inflation accelerated in December, but the move was anticipated and is unlikely to alter the central bank’s plans for more interest rate cuts.

Current View

Yesterday’s major market indices were boosted by the two fundamental economic and stock market metrics; inflation and earnings. The back-to-back inflation reports Tuesday and yesterday confirmed cooling inflation. Earnings report from some of the largest banks exceeded expectations. The broad based market rally is in the spirit of the bull market that has run the last two years. Yesterday’s burst was led by the tech stock heavy Nasdaq index, which jumped 2.5% – the best day since November 6. While the current market trend signal reads “uptrend under pressure”, the market is showing resiliency and this week’s inflation data removed one brick from the market’s wall of worry.

  • Industry Group Strength:  BULLISH. As of yesterday, 134 out the 197 groups I monitor are up year-to-date. 63 are down.
  • New Highs vs. New Lows: BULLISH. As of now, there were 139 new 52-week highs and 56 new 52-week lows.
  • Dow Dividend Yield:  BEARISH. The current yield for the Dow Jones Industrial Average is 1.74%. The 10-year Treasury now 4.61%. The benchmark interest rate is up from 3.81% a month ago – a 21% increase.
  • Volatility Index: BEARISH. Volatility has been volatile. The “VIX” is 16. It is up from 14 a month ago. The index is also known as the “Fear Index.” It is considered a contrarian indicator and therefore viewed as bullish as it rises indicating investors are becoming more fearful. The VIX:
  • Fear / Greed Index:  BEARISH.  Investors are driven by two emotions: fear and greed. Too much fear can create a condition of oversold/ undervalued stock prices. Too much greed can result in overbought/overvalued stock prices. The AAII Investor Sentiment Index is now neutral.   BE FEARFUL WHEN OTHERS ARE GREEDY. At 57, the Fear & Greed Index is down from 63 a month ago.

CLICK VIDEO FOR MORE ON THE “FEAR & GREED INDEX”

How CNNMoney’s Fear & Greed Index works

  • Bull / Bear Barometer:  Neutral. This secondary market indicator should also be viewed with a contrarian perspective. As of yesterday, according to the latest survey of stock market newsletter writers by Investor’s Intelligence (see below), bullish sentiment is 42.4%, up from 62.9% A month ago. The bear sentiment is now 32.2%, down slightly from 16.1% month ago. This reflects a notable decrease in bullish sentiment as bearish sentiment has increased. Consider this a contrarian indicator because the crowd is often wrong at market tops and bottoms. In other words, extreme bullishness has been seen near several market tops in the past, while extreme bearishness has been seen at market bottoms.
  • Put / Call Ratio: BEARISH. The ratio of put-to-call options is 0.54, down from 0.62 a month ago. The put-call ratio tracks the mood of what options investors are doing, not just saying. They typically buy puts if they think a stock will decline and calls if they think it will rise. If they’re buying lots of puts, they see the market declining. And if they’re loading up on calls, they’re generally bullish. Historically, market bottoms occurred when the reading spikes to 1.2 or more. Market tops are often made when the reading is 0.6 or less. Note how reliable this is with respect to the February record low coinciding with the market high. Keep in mind this is also a contrarian indicator.

ECONOMIC UPDATES

Global Economic Indicators & Analysis:

POSITIVE INDICATORS

Jobs Market Up: The jobs market flexed its strength in December, showing a big 256,000 gain in new jobs.  With employment up, unemployment remains down.

PPI Cooling: Wholesale prices rose modestly in December in a reprieve from a string of elevated inflation in the final months of 2024 that have likely delayed further cuts in U.S. interest rates. The producer-price index, where the seeds of inflation are planted, rose a mild 0.2% last month, the government said Tuesday. Wall Street had predicted an increase double that size. The rate of increase in wholesale inflation in the past 12 months rose to 3.3% from 3.0%, however. That’s the highest rate in almost two years. The core rate of wholesale inflation, which omits volatile food, energy and trade margins, increased an even smaller 0.1% last month. The best part of the wholesale price report was no increase in the cost of services, one of the biggest drivers of inflation in the past few years. Still, the cost of services has risen a sharp 4% in the past year — double the pre-pandemic average.

CPI Cooling, too: A key measure of consumer prices rose less than expected in December, perhaps calming at least temporarily fresh worries about a recent rebound in inflation. An uptick in inflation since the end of summer has stunted the stock market and spoiled plans by the Federal Reserve to keep lowering interest rates. Wall Street got a reprieve this week, however. Wholesale prices rose less than expected and the more critical consumer price index on yesterday also showed a milder increase. The so-called core rate of consumer prices that omits volatile food and energy prices rose 0.2% in the final month of 2024. That matches the smallest increase in six months. The Fed views the core rate as a better predictor of future inflation than headline CPI. The increase in the core rate in the last 12 months dipped to 3.2% from 3.3%. Overall consumer prices, meanwhile, showed a sharper 0.4% increase largely because of higher food and energy prices. Those prices are expected to taper off in January. The rise in consumer prices in the past 12 months moved up a few ticks to 2.9% from 2.7%, up from a post-pandemic low of just 2.4% three months ago.

Retail Sales Up: Retail sales rose at a solid pace in the final month of 2024, capping off a good holiday shopping season and suggesting the economy entered the new year with some momentum. Sales at U.S. retailers advanced a seasonally adjusted 0.4% in December, the government said today, just a hair below Wall Street’s forecast. Yet the increase in sales in November was also a bit stronger than originally estimated at 0.8%. Retail sales represent about one-third of all consumer spending and offer clues on the health of the economy. In 2024, retail sales rose almost 4%, a solid pace even after taking inflation into account.

WEAK INDICATORS

Jobless Claims Up: Initial jobless claims rose by 14,000 to 217,000 in the last week, in part due to a spike in claims from wildfire-ravaged California, the Labor Department said today. Claims in California rose an unadjusted 13,074 to 54,587 in the latest week, the data showed. Economists polled by The Wall Street Journal had estimated new claims would rise by 9,000 to 210,000.  The number of new claims based on actual filings — that is, before seasonal adjustments — jumped by 45,228 in the latest week to 351,885. The labor market remains resilient.

Empire State Index Down: Business activity declined in New York State in January, according to firms responding to the Empire State Manufacturing Survey. The headline general business conditions index fell fifteen points to -12.6. New orders fell modestly, and shipments were little changed. Delivery times were slightly longer, and supply availability was unchanged. Inventories grew slightly. Labor market indicators pointed to steady employment levels but a shorter average workweek. Both input and selling price increases picked up. Firms grew more optimistic that conditions would improve in the months ahead.