

|
Correction Intensifies…
As if the World Series and all the Halloween decorations aren’t enough to signal it’s once again October, stock market volatility should do it. As often referenced, October is usually the most volatility month of the year. Days like today go a long way to underscore that. We need look no further than the volatility index for that. The ‘VIX’, a.k.a. the “fear index”, soared 22% today. This action would be ordinarily abnormal, but remember what month it is.
Today’s market action was dismal. That’s my take on it. What I heard most of the trading day, starting with a nasty reversal from a higher open, were Wall St. cliches at their best. “The market is getting hammered”, “It is an ugly decline”, “It’s a tech wreck”, “We are deeper into correction territory”, “The market has fallen out of bed”, “Semi’s are getting crushed”, and “It was a real puke” are just some of what was said among the many talking heads on the major financial news networks. Then there was, “This is the worst month for the semiconductor index in a decade.”, and “Today was the worst day for the NASDAQ since August 18, 2011.” Then I turned off the office TV.
The fact is, there were many more sellers than buyers in the stock market today. What was disconcerting was the reversal and the intensity of the sell-off into the close. The DOW opened up over 100 points. At the close, it was down over 600. That type of bearish behavior is indicative of a market seeking a lower bottom, though now stretched to the down-side and perhaps over-sold. The intense fall into the closing bell was the opposite of yesterday. So was the impressive, bullish reversal in yesterday’s session. All of this speaks to market volatility.
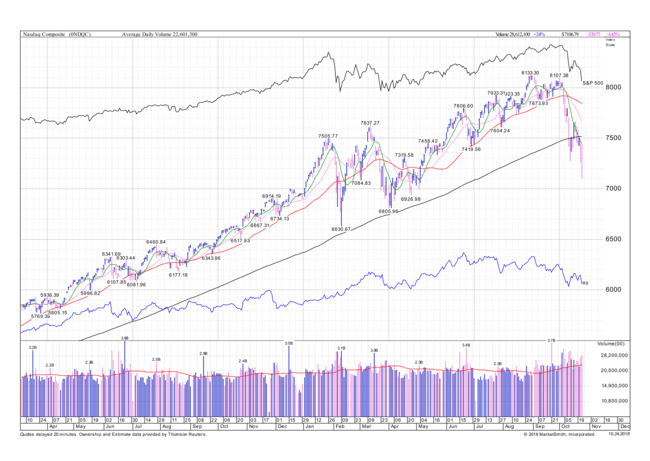
As I said in my last Market Update, I focus mainly on market technical conditions for hints of the market’s health and near term direction than anything else. Here is today’s look at the chart of the NASDAQ index below for an example of a major index in correction after breaching a key price support line:
What you can see by looking at the ascending, smooth black line, the NASDAQ has fallen sharply through it. The line is called a 200 day-moving-average, plotting daily closing prices for 40-weeks. Notice how this important growth market stock index has not been below that key support line for the entire duration of the chart, which is 12 months, except in recent days. Today it fell hard below it.
What now? Earnings. Earnings. Earnings. And after more earnings, the market will remain in the grip of fear of higher interest rates. Keeping with the Halloween theme, the market is also spooked by tariffs, slowing earnings and economic growth and the midterm elections. Earning surprises, both positive and negative, are likely to thrust the market rapidly near term in both directions.
In the midst of the furious stock sell-off today, our BAM Strategic Income and Diversified Value portfolios showed relative price strength as stocks such as P&G and Coke were up.
|
| Thank you for your continued trust and confidence. I remain vigilant as I manage and oversee your investment account.
Please call anytime you have a question or I may be of help. I am always happy to be of service. Sincerely, John Gardner
|