


In as much as the U.S. stock market is now held hostage to tariffs, interest rates and corporate earnings reports, it is in a TIE. The bull market, though, in the constant battle with the bear, is not in a tie; it is losing to the bear.
|
Tariffs Taking a Toll…
Which is more accurate? One day I read a market research piece with this headline, “Why Tariffs Aren’t Scaring the Stock Market.” No reason to name the source. The very next day I read another report (also without naming the source) titled, “How The Trump Tariffs Could Sink The Economy And Stocks.” They can’t both be right. Here’s what they had to say worth considering. The bottom line to the first, in essence, was that this is a cold war on trade, with both the U.S. and China aware that a reduction in trade flows poses mutually assured destruction of their economies (or MAD), as the policy was abbreviated during the actual Cold War. That made launching the “big one” unthinkable, and nuclear war didn’t happen. By analogy, the markets assume a destructive descent into protectionism won’t proceed as in the 1930’s. Expressing the word ‘tariff’ as a verb, this premise contends the financial markets have lost their fear of being “Tariffed”. Initially, the escalation of tariffs imposed by the U.S. against China, with the predictable countermoves by China versus the U.S., failed to cause much fear in global equity markets. This muted reaction followed the Trump administration’s announcement a month ago that it would impose a 10% tariff on $200 billion of Chinese goods, which was followed by Beijing placing tariffs on an additional $60 billion of U.S. goods. The U.S. levy is slated to rise to 25% at the end of the year. This tune has changed, however, as I will note shortly. The first report closed with, “a trade war remains the No. 1 “tail risk” among institutional investors polled in the latest Bank of America Merrill Lynch fund manager survey. Some 43% of the respondents called a trade war the biggest risk in this month’s survey. But that was down more than 10 percentage points from the previous month’s poll.“
The second research piece take a more matter-of-fact view, choosing to highlight only how the U.S. stock market reacted to protectionism policies of the past. Put simply, the stock market doesn’t like tariffs, and if Trump’s tariff threats push too far, they could up-end the stock market. The fact based article focused on the great bear market of the 1930’s, citing the protectionist Smoot-Hawley bill that President Hoover signed in 1930. The economy ensuingly fell into a long slump. GDP dropped 8.5% in 1930, 6.4% in 1931 and then slid 12.9% in 1932.
 Which ever of the two is more accurate is less important than what is happening now. Just this Tuesday, Caterpillar, the world’s largest construction equipment maker, said before the market opened that Trump’s steel import tariffs, along with higher freight charges, cost it about $40 million in its most recent quarter. CAT’s stock collapsed, down nearly 8% by mid-day trading. Also on Tuesday, 3M Corp. cited tariffs as a negative factor with its quarterly earnings report. MMM’s stock nearly 6% after its sales fell below forecasts by the most in 2 years and the company cut its earnings estimates due to a slowdown in China and rising tariff costs. Just another example, Ford Motor Company said in late September that steel tariffs have already cost the company $1 billion in profits. A final note on the ‘T’ in TIE. Yesterday, in the Federal Reserve’s Beige Book economic report, which is based on anecdotal information collected by the 12 regional Fed banks through October 15th, it noted concerns trade wars were putting pressure on many corporations. The Beige Book specifically pointed to anxiety among U.S. firms over the ongoing trade dispute with China. Manufacturers reported they were raising prices out of necessity as tariffs drove up the cost of raw materials, including metals. “New car prices are also expected to increase significantly to cover the burden of recently implemented tariffs,” the Boston Fed reported in one of many anecdotes included in the survey. The “T” in TIE is effecting the ‘I’ and the ‘E’.
Interest in Interest Rates…
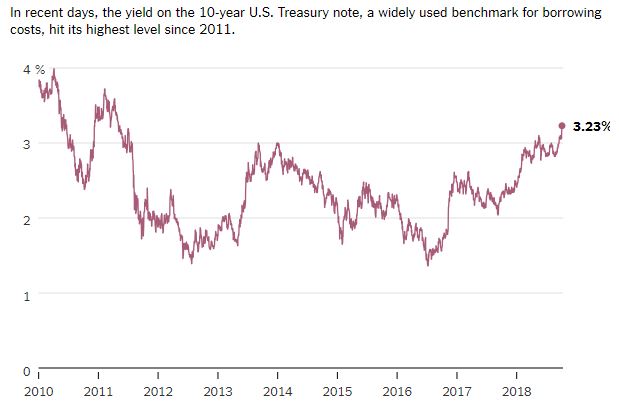 As the chart above shows, interest rates have shot-up to levels not seen since 2011. Just since late August, the benchmark 10-year U.S. Treasury bond yield has jumped from about 2.8% to 3.15% now. Keep perspective. That short-term move up is not just 35 basis points, it is an increase of 12.5%.
The Federal Reserve has already raised short-term interest rates by a quarter point three times so far this year, following three hikes last year. Fed funds futures traders widely expect the U.S. central bank to boost the cost of overnight loans to big banks by another 25 basis points in December to a range of 2.25%-2.5%. That would mark the highest level since January of 2008, when the fed funds rate was at 3%. Amid the subprime debt crisis brewing back then, the Fed then slashed the fed funds rate by three quarters of a point to 2.25% in March of that year. The rise in yields is a double-edged sword. It reflects optimism about the economy, but also gives traders reasons to worry. Simpy put, as rates rise, borrowing will also become more expensive for consumers and companies, potentially slowing growth. Higher rates also change the balance of risk and reward for investors in other markets. Consistent with this, the stock market is now in correction mode. So, rising rates are pulling other key borrowing costs higher. Rates on conventional 30-year fixed-rate mortgages are above 4.7%, the highest level since 2011. Likewise, interest rates on 48-month new car loans have risen to more than 5%. They haven’t been that high since 2012. Earnings. The ‘E’ in TIE…
 Earnings matter. A lot. I have said my entire career, after studying Wall Street’s best in history, that a company’s earnings are the single most important determining factor of its’ stock price. This year corporate earnings have been good. Perhaps, too good. As of yesterday, company third quarter earnings reports have been stellar, on average up an impressive 22% year-over-year. Over 80% of company’s that have reported beat analysts estimates. These numbers have many market mavens now warning of “peak earnings”. This basically infers that high earnings growth has peaked, only to slow going forward. Some even think earnings will slow sharply next year as the benefits of Trump tax cuts are less helpful and Trump tariffs are more harmful. “The trend is your friend” is an old tried and true Wall Street axiom. With that said, the earnings trend is not good. The current 22% rate of growth is cooling from the second quarter’s torrid rate of more than 25%, according to FactSet. Current fourth quarter earnings estimates are for profit growth of 16.5%. For 2019, Wall Street expects earnings growth of about 10%. But the first half of the year may be in the 7% growth ballpark, FactSet estimates. You could call it the twilight zone of corporate profit growth; a no man’s land where growth is still OK, but not enough to thrill the bulls hooked on the red-hot years of 2016 and 2017.
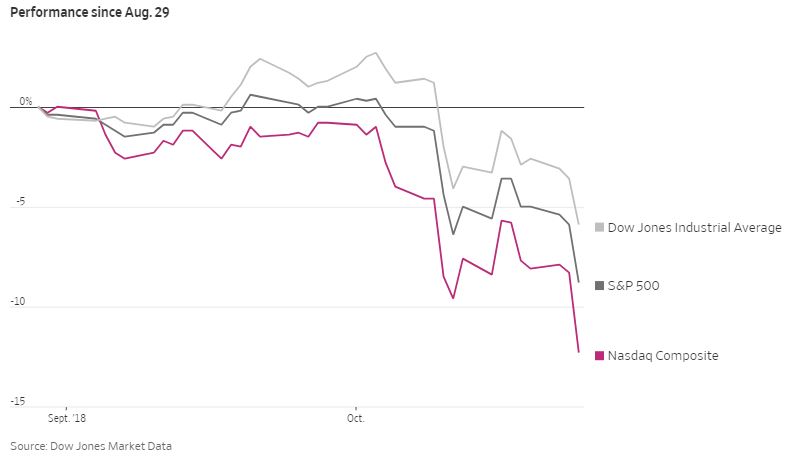
Many have hoped the strong growth in earnings would stabilize the stock market. Instead the market is doing what it does best…discounting future expectations. The peak earnings concern, met with fear, uncertainty and doubt (FUD) over tariffs and interest rates has the market in a TIE.
|
|
|
|
TAKING PERSPECTIVE….
|
 Today’s Perspective:
In our hectic and often hard to comprehend world, it is very easy to lose perspective. You may agree it is sometimes difficult to see the big picture. The media often doesn’t help with this, but unfortunately instead encourages us to see things in a most negative light. Here is hopefully a pause to gain positive perspective…
On: ADVERSITY
“There is no success without hardship.”
Sophocles
|
|
|
|
MARKET ANALYSIS
|
|
Indicators of Interest:

|
|
|
|
ECONOMIC UPDATES
|
|
Key Global Economic Indicators & Analysis:
POSITIVE INDICATORS:
Pending home sales rise: U.S. pending home sales edged up 0.5% to a reading of 104.6 in September from 104.1 in August, the National Association of Realtors said today. The consensus forecast among economists was for no change. NAR’s index, which tracks real estate contract signings, snapped a four month losing streak. But it was lower than year ago levels for the ninth month in a row, this time by 1.0%. Contract signings usually precede closings by about 45 days, so the pending home sales release is considered a leading indicator for the existing home sales report. Markit Manufacturing and Services PMI strong: The flash reading of IHS Markit’s manufacturing purchasing managers index rose to a five month high of 55.9 in October from 55.6, while the flash services PMI rose to a two month high of 54.7 from 53.5 in September. Any reading above 50 indicates improving conditions. A flash reading is composed of 85% to 90% of the total. The U.S. economy stepped up a notch in October after hurricane disruption last month. Improving domestic economic conditions were the main factor behind rising client demand, IHS Markit said. However, managers complained about higher cost burdens and stretched domestic supply chains in the wake of trade tariffs, the group said. Durable goods orders rise: Orders for durable goods increased 0.8% in September, the third gain in the last four months, the government said today. The gain was well above expectations. Economists had forecast a 1.9% drop in durable goods following a 4.6% jump in the prior month. The rise in September was powered by orders for transportation and defense goods. Orders for core capital goods, closely watched by economists, fell 0.1%.
WEAK INDICATORS:
Weekly Jobless claims rise: The number of people who applied for U.S. unemployment insurance benefits rose by 5,000 to 215,000 in the week that ended October 20, according to Labor Department data released today. Claims were higher in Georgia and Florida, two states hit hard by Hurricane Michael. The big picture is that employers are laying off very few workers, with weekly claims staying close to 50-year lows. Economists had expected claims for regular state unemployment insurance benefits to remain steady at 210,000. New Home sales fall: Sales of newly constructed homes swooned to the lowest since December 2016. September’s selling pace of 553,000 was 5.5% lower than in August, and 13.2% lower than a year ago. Sales badly missed the consensus forecast of a 620,000 pace, and revisions to prior months were all downward. For years, the housing story has been about strong demand, and limited supply. That dynamic may be starting to shift, however, as unrelenting price gains, higher mortgage rates, and scant choices may be nudging would be homebuyers out of the market. Existing Home sales down: Existing home sales ran at a seasonally adjusted annual rate of 5.15 million in September, the National Association of Realtors said Friday. That was a 3.4% decline for the month, and the lowest pace of sales since November 2015. Sales of previously owned homes stabilized in August after declining for four straight months, so September’s lurch lower was surprising to some. Sales were 4.1% lower than year ago levels. September’s selling pace missed the consensus forecast of a 5.27 million rate. U. S. Trade deficit widens: The U.S. trade deficit in goods widened to a seasonally adjusted $76.0 billion, according to a preliminary report out today from the Census Bureau. Exports rose 1.8%, or $2.5 billion, while imports rose 1.5%, or $3.1 billion. Economists had forecast a deficit of $76.2 billion. For a second month, exports of foods, feeds and beverages succumbed to the U.S.-China trade war, which has stopped China from buying American soybeans.
|