ERPE Excerpts 9.25.2025 … Fast Fun Facts

Bi-MONTHLY MARKET ANALYSIS &

ECONOMIC UPDATES

September 25, 2025

Fast Fun Facts

On a lighter ERPE Excerpts, here are some fast, fun facts. While typically sharing capital market and global economic developments that I think are timely and relevant, today’s ERPE Excerpts is intended to pass on some stats and facts that you might find interesting…

  • They’re betting on it… A study by researchers at the University of Bristol analyzed gambling marketing during the six Stanley Cup finals games this year and the seven NBA finals games. Across those 13 games, researchers recorded 6,282 instances of gambling-related marketing. Source: The Guardian
  • More buy now pay now… After a surge in credit-card spending that pushed Americans’ card balances above $1 trillion, growth is now moderating. Credit-card spending has been growing more slowly than debit-card spending since late last year, the first such stretch in nearly four years, according to the latest spending data from Visa and Mastercard. Source: The Wall Street Journal
  • Wonder what ChatGPT thinks about this… The U.S.’s largest companies have spent 2025 locked in a competition to spend more money than one another, laying out $155bn on the development of artificial intelligence, more than the U.S. government has spent on education, training, employment and social services in the 2025 fiscal year so far. Source: The Guardian
  • Liquid assets… Of the estimated 29 billion gallons of water used daily by households in the U.S., nearly 9 billion gallons, or 30%, is devoted to outdoor water use. In the hot summer months, or in dry climates, a household’s outdoor water use can be as high as 70%. Source: Environmental Protection Agency
  • Tangible assets… In June the national median sales price for homes rose to an all-time high of $435,300. Home prices increased on an annual basis for the 24th consecutive month to reach record heights. Source: NBC News
  • Working to live or living to work… In 2024, 19.5% of people age 65 and older participated in the labor force (23.4% of men and 16.2% of women). Source: U.S. Bureau of Labor Statistics
  • The real Monopoly… So far in 2025, investors who buy homes to flip or rent out have made up about 30% of purchases of both existing and newly built single-family homes, the highest share on record, according to property analytics firm Cotality, which started tracking the sales 14 years ago. Small investors made up about 25% of these home purchases. Source: The Wall Street Journal
  • Good times for DoorDash… According to the National Restaurant Association, nearly 75% of all restaurant traffic is now off-premises—pickups, deliveries, and drive-thru’s. Source: Restaurant Business
  • Eureka… According to 2024 data from the International Monetary Fund and the U.S. Bureau of Economic Analysis, California’s nominal GDP hit $4.1 trillion, surpassing Japan’s $4.02 trillion, making it the world’s fourth-largest economy after the U.S., China, and Germany. Its economy grew by 6%, outpacing the growth rates of the U.S. (5.3%), China (2.6%), and Germany (2.9%). Source: Yahoo! Finance

What Fun Fact surprised you the most?

TAKING PERSPECTIVE…

Proper Perspective:  In our hectic and often hard to comprehend world, it is very easy to lose perspective. You may agree it is sometimes difficult to see the big picture. The media often doesn’t help with this, but unfortunately instead encourages us to see things in a negative way. Here is hopefully a pause to gain positive perspective.

Famous Quote On This Day:   “It is righteousness that exalteth a nation while sin is a reproach to any people.”

~~ Frederick Douglass, 1847

What Happened On this Day September 25, 1890: – The Sequoia National Park, located in south Sierra Nevada in California, was established by the United States Congress.

MARKET ANALYSIS

INDICATORS OF INTEREST:

  • Market’s Current Signal: Confirmed Uptrend.  Analysis of the stock market over 130 years of history shows we can view it in terms of three stages -market in uptrend, uptrend under pressure and market correction.  Since the 1880’s, this perspective has led to investment out-performance relative to market indexes. This is due to trend analysis which determines risk reducing, return enhancing market entry and exit points. The U.S. stock market’s current signal indicates the market is in Confirmed Uptrend. That officially happened April 22 and is still intact. This has been the fastest market rebound from a bear market low in history. The uptrend is remains.

The Stock Market Trend: Confirmed Uptrend. The stock market powered higher Tuesday, April 22 and the Nasdaq and S&P 500 confirmed new rally attempts. That follow-through signaled a Confirmed Uptrend. In late June the major stock market indexes reclaimed levels set in late February and significantly above the pre-“Liberation Day” level. The major indexes are making new all-time record highs. Monday was the 28th new high of 2025 for the SP 500.

Here are key market levels as of Monday, September 25:

Recapping Last Week

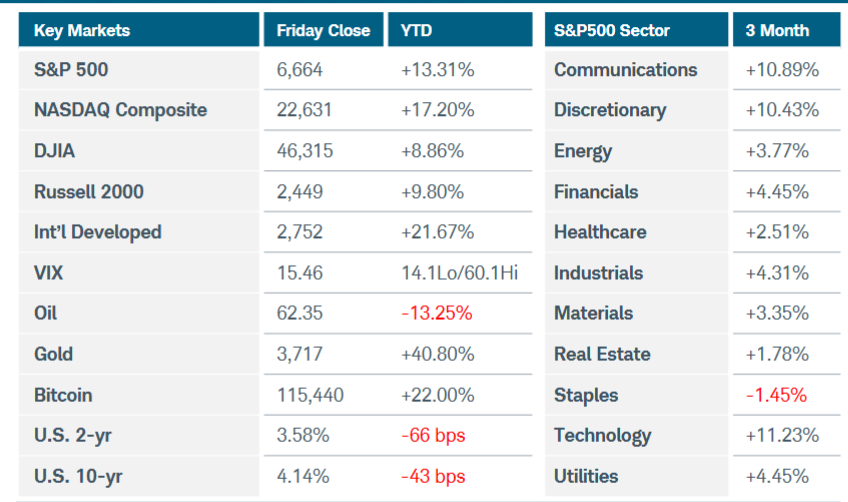
U.S. equity indices gained ground after the Federal Reserve restarted the interest rate easing cycle, lowering its benchmark rate by 25 basis points to a 4.00% to 4.25% range. The Russell 2000 index jumped more than 2%, reaching a new record high for the first time since last November. The Nasdaq Composite index also rose more than 2% while the S&P500 added just over 1%. Technology led mixed performance in S&P500 sectors, boosted by news of Nvidia’s massive investment in Intel. U.S. Treasury yields ended the week flat at the short end and higher at the long end despite the Fed signaling two additional rate cuts for this year. While Fed Chair Powell said that the softening labor market was now top of mind for the committee, the central bank’s statement acknowledged that inflation hasn’t just remained elevated but has moved up. Powell characterized the rate decision as a “risk-management cut” in reaction to weakening jobs data, but stubborn inflation underscores the Fed’s challenges in carrying out its dual mandate. In its Summary of Economic Projections, the FOMC raised its GDP growth and inflation forecasts while lowering the projected unemployment rate, seemingly in conflict with easing monetary policy. The updated “dot plots” suggested only one more rate cut in 2026 to a range of 3.25% to 3.50%, which is higher than market expectations of a sub-3% fed funds rate. Turning to economic data, U.S. retail sales rose 0.6% in August, rounding out a resilient summer of consumer spending. Jobless claims fell back to 231,000, likely confirming that the prior week’s large jump was an anomaly. Regional manufacturing surveys from the northeast revealed widely diverging sentiment. Activity in New York State declined more than expected on a large drop in new orders, while the Philly Fed survey spiked into positive territory as shipments surged. In housing news, new construction plunged last month while building permits fell to the lowest level in more than five years. Mortgage rates fell last week to 11-month lows, but persistent U.S. budgetary and inflation pressures still clouded the outlook for homebuyers seeking more affordable conditions.

Overseas, the Bank of England kept rates unchanged at 4% after last month’s CPI reading held steady at 3.8%–the highest among developed economies. UK labor market data has held up well enough to not raise recession concerns. The BOE also announced plans to slow the pace of reducing its stockpile of government bonds to minimize the impact on the volatile gilt markets. The Bank of Canada cut rates by 25 basis points to 2.5% but gave little indication of next steps even as economic data showed signs of increasing stress. Japan’s central bank revealed a more hawkish turn despite leaving rates unchanged at 0.5%. Two of the nine board members voted for a quarter-point hike while the Bank of Japan also decided to start selling its riskier ETF holdings sooner than expected. Core CPI readings have eased recently but Japan’s headline inflation has remained well above the 2% target for more than three years. Finally, China’s industrial production and retail sales figures for August came in lower than estimates, while unemployment inched up to a six-month high of 5.3%.

Current View

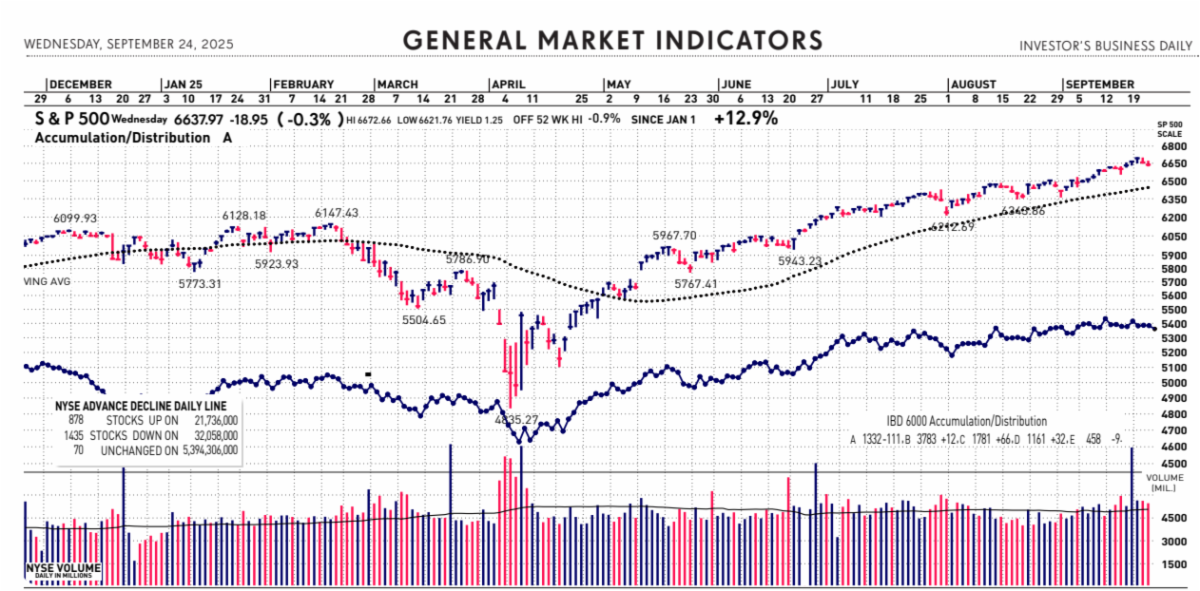
Since comments made by Federal Reserve Chair Jerome Powell in his Alan Greenspan moment during a fireside chat-style symposium in Warwick, R.I., saying the stock market is “fairly highly valued”, the major stock indices have mostly declined. Not that he is wrong, the market is overextended, but Greenspan was famously 4-years early with his call…. The Nasdaq, S&P 500 and Russell 2000 all finished above or very close to their short-term 10-day moving averages yesterday. While this is clearly a short-term observation, it is worth a look. The evidence is this moving average is experiencing the fastest rise in the slopes of these lines since early July. There has been a lot of bubble talk recently. Here’s perspective: When the Nasdaq-100 tech index peaked in March 2000, it was roughly 56% above its 200-day moving average. Today that number is closer to 13%. The current bull run in stocks hasn’t yet reached three years, given that stocks bottomed out in October 2022. Over the past 50 years, he said there have been five bull markets that lasted more than two years, and the average length was eight years.

  • Industry Group Strength:  BULLISH. As of yesterday, 123 out the 197 groups I monitor are up year-to-date. 74 groups are down for the year.
  • New Highs vs. New Lows:  BULLISH. In yesterday’s session, there were 119 new 52-week highs and 84 new 52-week lows.
  • Dow Dividend Yield:  BEARISH. The current yield for the Dow Jones Industrial Average is 1.83%. The 10-year Treasury now 4.18%.
  • Volatility Index: NEUTRAL. Volatility has been volatile. The “VIX” is now 16, the same as two weeks ago. The index is also known as the “Fear Index.” It is considered a contrarian indicator and therefore viewed as bullish as it rises indicating investors are becoming more fearful. The VIX:
502fdd07-23bc-47a7-ad04-cc3b3f2387db image
  • Fear / Greed Index:  BEARISH.  Investors are driven by two emotions: fear and greed. Too much fear can create a condition of oversold/ undervalued stock prices. Too much greed can result in overbought/overvalued stock prices. The AAII Investor Sentiment Index is now neutral.   BE FEARFUL WHEN OTHERS ARE GREEDY. At 57, the Fear & Greed Index is up from 51 two weeks ago.

CLICK VIDEO FOR MORE ON THE “FEAR & GREED INDEX”

How CNNMoney’s Fear & Greed Index works

  • Bull / Bear Barometer:  NEUTRAL. This secondary market indicator should also be viewed with a contrarian perspective. As of yesterday, according to the latest survey of stock market newsletter writers by Investor’s Intelligence, the bullish tally is 58.5% up from 57.7% two weeks ago. The bears are 17%, down from 17.6% two weeks ago. Consider this a contrarian indicator because the crowd is often wrong at market tops and bottoms. In other words, extreme bullishness has been seen near several market tops in the past, while extreme bearishness has been seen at market bottoms.
  • Put / Call Ratio: NEUTRAL. The ratio of put-to-call options is 0.66, down from 0.71 two weeks ago. The put-call ratio tracks the mood of what options investors are doing, not just saying. They typically buy puts if they think a stock will decline and calls if they think it will rise. If they’re buying lots of puts, they see the market declining. And if they’re loading up on calls, they’re generally bullish. Historically, market bottoms occurred when the reading spikes to 1.2 or more. Market tops are often made when the reading is 0.6 or less. Note how reliable this is with respect to the February record low coinciding with the market high. Keep in mind this is also a contrarian indicator.
a9cae921-90fb-41e6-ab01-6918d0854b19 image

ECONOMIC UPDATES

Global Economic Indicators & Analysis:

POSITIVE INDICATORS

Jobless Claims Down:  Initial jobless claims fell by 14,000 to 218,000 in the last week, the Labor Department said Thursday. That’s the lowest level since mid-July. Economists polled by The Wall Street Journal had estimated new claims would rise by 4,000 to 235,000. Claims have been volatile in recent weeks, spiking by 28,000 to a nearly four-year high of 264,000 earlier this month. That raised some concerns that layoffs were rising. But claims have fallen by 46,000 in the past two weeks. Another sign the labor market is not weakening is that the number of new claims based on actual filings — that is, before seasonal adjustments — fell by 14,822, to 180,611, in the latest week. That’s the lowest level in two years.

GDP Revised Higher (again): The US economy’s comeback in the second quarter was just revised higher again, and economists estimate that momentum carried on in the third quarter, underscoring the resilience of the world’s largest economy. Gross domestic product, the broadest measure of economic output, rose at an annualized rate of 3.8% from April through June, the Commerce Department said Thursday in its third and final estimate. That’s significantly higher than the 3.3% rate reported in the second estimate, and well above the 3% initially reported.

GDP was revised higher largely due to new additional data on consumer spending. Personal consumption expenditures rose at an annualized pace of 2.5% in the second quarter, according to the third estimate, up sharply from the second estimate’s 1.6%.

Durable Goods Orders Up:   The industrial side of the U.S. economy has been rocked by higher tariffs, but a saving grace has been new tax cuts for investment and a frenzy of spending in artificial intelligence. Business investment rose sharply in August to mark the second strong increase in a row, the government said today — a sign of some underlying strength in the U.S. economy. So-called core durable-goods orders climbed 0.6% last month and added to a recent uptrend. Companies have increased spending on computers, software and other technologies in an effort to incorporate AI into how they do business. New federal tax breaks on business investment more broadly are also lending a helping hand. The trade wars have died down, but they are still a thorn in the side of American manufacturers. Business appears to have stabilized, however, and growth could kick up next year as the effects of tariffs fade.

Interest Rate Cut: The Federal Reserve cut its benchmark interest rate by 25 basis points last Wednesday, the first rate move since last year, as it penciled in two more reductions for this year. The bank’s “dot plot” also showed two more cuts before the end of the year. That seemed like a dovish tone, meaning the Fed was worrying less about inflation.

Retail Sales Up: Retail sales rose strongly in August for the third month in a row, a sign that households are spending at healthy levels despite worries about lingering inflation and a weakening job market. Receipts at retail cash registers increased 0.6% last month, the government said last Tuesday, and outlays in July were revised higher. That was twice as big an increase as Wall Street expected.Sales of new cars and parts increased in August for the third month in a row. Car shoppers have been buying more vehicles than usual for the past several months to avoid anticipated price increases in the coming months as tariffs take full effect. Automobile sales account for one-fifth of all retail sales and have an outsize effect. Sales omitting autos and gasoline, a better way to measure trends in retail spending, rose an even stronger 0.7%.

Industrial Production Up: Industrial production ticked up 0.1% in August after decreasing 0.4% in July, according to a report last Tuesday. Manufacturing output rose 0.2% in August after edging down 0.1% in July. Within manufacturing, the production of motor vehicles and parts increased 2.6% in August, while factory output elsewhere edged up 0.1%. The index for mining moved up 0.9%, and the index for utilities decreased 2.0%. At 103.9 percent of its 2017 average, total IP in August was 0.9% above its year-earlier level. Capacity utilization maintained the same rate of 77.4% in August, a rate that is 2.2 percentage points below its long-run (1972–2024) average.

New Home Sales Up:  Sales of new homes spiked in August as builders piled on discounts and slashed prices to lure buyers. The sales rate for new single-family homes in August was 800,000, the Commerce Department reported Wednesday. New-home sales jumped 20.5% in August from the previous month, to the highest level since January 2022. The numbers are seasonally adjusted and refer to how many homes would be built over an entire year if builders continued at the same pace every month.The new-home sales figure vastly exceeded expectations on Wall Street. Economists surveyed by Dow Jones Newswires and the Wall Street Journal expected new-home sales to drop to a 650,000 pace in August. The last time new-home sales jumped by this much was in August 2022. The increase in sales is possibly evidence that builders’ tactic of offering aggressive discounts to attract buyers has paid off.

WEAK INDICATORS

LEI Down:   The Conference Board Leading Economic Index® (LEI) for the US declined by 0.5% in August 2025 to 98.4, after a small 0.1% increase in July (upwardly revised from an originally reported 0.1% decline), according to its report released last Thursday. The LEI fell by 2.8% over the six months between February and August 2025, a faster rate of decline than its 0.9% contraction over the previous six-month period (August 2024 to February 2025).

U.S. Existing Home Sales Down:  Sales of existing homes fell nationwide by 0.2% in August from the previous month, according to the NAR today, dropping to a 4 million pace. That’s the number of homes that would be sold over an entire year if sales took place at the same rate in every month as they did in August. The numbers are seasonally adjusted. Home sales were slightly elevated compared with the same month a year ago. The pace of sales exceeded expectations of economists surveyed by Dow Jones Newswires and the Wall Street Journal, who expected sales to fall to a 3.96 million pace in August.

Home Builder Optimism Index Unchanged: Builder confidence in the market for newly built single-family homes was 32 in September, unchanged from the August reading, according to the National Association of Home Builders (NAHB)/Wells Fargo Housing Market Index (HMI) released last Wednesday. While builder sentiment has hovered at a relatively low reading between 32 and 34 since May, builders expressed optimism that a more favorable interest rate climate could bring hesitant buyers off the sidelines in the final quarter of 2025.

Call me if you have any questions. I am always happy to help!

John J. Gardner, CFP®, CPM®.AIF®

Blackhawk Wealth Advisors, Inc.

3860 Blackhawk Rd, Ste. 160 Danville, CA. 94506

Phone: 888-985-PLAN · Email: jg@blackhawkwealthadvisors.com

BLACKHAWKWEALTHADVISORS.COM

For my Quarterly Market Focus podcast, click on the link below. I provide a review of global stock market highlights over past quarter and preview of the quarter ahead. Forward insights and perspectives are based on current financial market and economic trends with an emphasis on relevant developments in various areas from Fed policy to company earnings announcements.

LinkedIn
810c9060-6bc9-4e20-948f-60bee7c1b0be image
dc6d6594-dfce-48b0-8d69-3a27db12748d image
7d2eabf6-51c8-425f-b667-128ed7bc0dd2 image

Blackhawk Wealth Advisors is the parent corporation of Equity Research & Portfolio Evaluation and Blackhawk Asset Management. It’s Chief Investment Officer is John J. Gardner. John is a Certified Financial Planner (CFP®) and Certified Portfolio Manager (CPM®). As an AIF®, John is also an Accredited Investment Fiduciary.

CUSTOMIZED. STRATEGIC. DYNAMIC.