ERPE Excerpts 9.26.2024 Wall Street and Party Control

dc6d6594-dfce-48b0-8d69-3a27db12748d image

Presents our

Bi-Monthly

 ERPE Excerpts

John J. Gardner, CFP®, CPM®

blackhawkwealthadvisors.com

Bi-MONTHLY MARKET ANALYSIS &

ECONOMIC UPDATES

September 26, 2024

Wall Street and Party Control

The Election Outcome that Might Matter Most

Not only does the presidential race remain “up for grabs,” but the congressional races are hotly contested as well. This might matter more to the stock market. The current profile of Congress (as of September 12), shows the Republicans hold a slim 220 to 211 majority in the House of Representatives (House), with all seats on the ballot, and the Republicans hold an even slimmer 49 to 47 majority in the Senate (plus 4 Independents who all caucus with the Democrats), with 33 seats on the election ballot. Stock market history shows that how Congress is controlled impacts the market more than the winner of the Oval Office. A “split” Congress could remain split or go all red (Republican) or all blue (Democrat). The graph below tells the story since 1945.

First, note that the U.S. stock market (SP 500 index) has produced positive average annual gains with either Democrat or Republican leadership. The S&P 500 has performed better with a Democrat president, although the best returns have come when Republicans control both the House and Senate, regardless of which party holds the presidency.

As I noted in my last ERPE Excerpts September 12, stock market volatility has historically increased in Presidential Election years. This is in essence a function of highly uncertain outcomes and speculation. For example, leading up to the 2016 election, the SP 500 dropped nearly 6% between mid-August and November 4, the Friday before the election. From election eve, November 7, to March 1, 2017 the index surged over 15%. So far, 2024 election year volatility has not hit the market. Instead the bull run has climbed the wall of worry and investors have embraced every dip with an appetite to buy. Through yesterday the SP 500 is up 1.31% this month. It is on track to be the first positive September for the index in 5 years. Factors contributing to 2024 gains so far are likely solid economic growth, lower interest rates, and technology investment led by AI. It appears to me that election FUD (fear uncertainty & doubt) has not weighed on investment returns this year. Given the many surprises in the presidential race to this point, along with still highly uncertain outcomes ahead including the congressional contests, we wouldn’t be at all surprised if the VIX (the market “fear index”) was spiking. It, though, is not.

Perhaps the market is discounting a “split” Congress as we essentially have now. It is often said that Wall Street likes a divided government (more difficult to pass major legislative changes) and are fearful of one-party control. The graph above, though, indicates the SP 500 index has done well when one-party control has been in place for 33 of the 79 (42%) years.

While most attention is given to the major market index, proper perspective when evaluating the stock market requires sector analysis. The SP 500 index is comprised of 11 sectors (e.g., health care, technology, financial). Here are how the stock market sectors performed under the last two administrations. Below is the sector performance during the four years of the Trump Administration. The S&P rose +67.8% over the four-year period, led by Technology and Consumer Discretionary. Only those two sectors outperformed the overall index, and Energy was not only the worst performer, but declined -48.4%.

The graph below shows the S&P 500 sector performance during the 3.7-years (full term has months remaining) of the Biden Administration. The S&P 500 has increased +49.8% from 12/31/20 through 9/25/24, led by Energy, Technology, and Financials. Just three sectors beat the index, and no sectors declined.

Typically, Congress and the Federal Reserve can play a bigger role in directly shaping markets, compared to the president. Congress sets tax rates, passes spending bills, and writes laws regulating the economy. That said, there are some ways that the president can affect the economy and the market. The independent Federal Reserve can have a significant impact by raising (bearish) or lowering (bullish) interest rates. Presidents have very little impact on the stock market, but they still seem to get some credit when performance is good and more of the blame if markets are down. This year’s Presidential Election outcome on Congress should be what matters most.

TAKING PERSPECTIVE

Proper Perspective:  In our hectic and often hard to comprehend world, it is very easy to lose perspective. You may agree it is sometimes difficult to see the big picture. The media often doesn’t help with this, but unfortunately instead encourages us to see things in a most negative light. Here is hopefully a pause to gain positive perspective.

Famous Quote on This Day:

“It seems still more impossible that a quarrel which has already been settled in principle should be the subject of war.”

~~ Neville Chamberlain, 1938

What Happened On This Day September 26, 1960 – The first televised debate is held in Chicago between presidential candidates Nixon and J.F.K

MARKET ANALYSIS

INDICATORS OF INTEREST:

  • Market’s Current Signal: Market in confirmed uptrend.  Analysis of the stock market over 130 years of history shows we can view it in terms of three stages – market in uptrend, uptrend under pressure and market correction. I analogize this to a traffic signal’s changing colors from green to yellow and then to red. It is still green. Since the 1880’s, this perspective has led to investment out-performance relative to market indexes. This is due to trend analysis which determines risk reducing, return enhancing market entry and exit points.

The Stock Market Trend: Market in confirmed uptrend. After a market peak July 16 with the SP500 at 5,670, a market correction ensued with a 10% fall to 5,120 on August 5. The market’s trend turned bullish Tuesday, August 13. The fourth day of a new rally attempt confirmed the rally with a follow-through day. As of yesterday the SP500 is up 1.3% and on track to be the first positive September in 5 years.

Here are key market levels as of Monday, September 23.

  • Industry Group Strength:  BULLISH. As of yesterday, 163 out the 197 groups I monitor are up year-to-date. 34 are down.
  • New Highs vs. New Lows: BULLISH. As of now, there were 270 new 52-week highs and 76 new 52-week lows.
  • Dow Dividend Yield:  BEARISH. The current yield for the Dow Jones Industrial Average is 1.86%. The 10-year Treasury now 3.81%.
  • Volatility Index: NEUTRAL. Volatility has been volatile. The “VIX” is near 15. It is down from 17 two weeks ago. The index is also known as the “Fear Index.” It is considered a contrarian indicator and therefore viewed as bullish as it rises indicating investors are becoming more fearful. The VIX:
502fdd07-23bc-47a7-ad04-cc3b3f2387db image
  • Fear / Greed Index:  BEARISH.  Investors are driven by two emotions: fear and greed. Too much fear can create a condition of oversold/ undervalued stock prices. Too much greed can result in overbought/overvalued stock prices. The AAII Investor Sentiment Index is now neutral.   BE FEARFUL WHEN OTHERS ARE GREEDY. At 71, the Fear & Greed Index is up from 42 two weeks ago.

CLICK VIDEO FOR MORE ON THE “FEAR & GREED INDEX”

How CNNMoney’s Fear & Greed Index works

  • Bull / Bear Barometer:  NEUTRAL. This secondary market indicator should also be viewed with a contrarian perspective. As of yesterday, according to the latest survey of stock market newsletter writers by Investor’s Intelligence (see below), bullish sentiment is 43.5%, down sharply from 53.2% two weeks ago. The bear sentiment is now 22.6%, near the same two weeks ago. This reflects a decrease in bullish and bearish sentiment over the last two weeks. Consider this a contrarian indicator because the crowd is often wrong at market tops and bottoms. In other words, extreme bullishness has been seen near several market tops in the past, while extreme bearishness has been seen at market bottoms.
  • Put / Call Ratio: BEARISH. The ratio of put-to-call options is 0.52.  Down from 0.77 two weeks ago. The put-call ratio tracks the mood of what options investors are doing, not just saying. They typically buy puts if they think a stock will decline and calls if they think it will rise. If they’re buying lots of puts, they see the market declining. And if they’re loading up on calls, they’re generally bullish. Historically, market bottoms occurred when the reading spikes to 1.2 or more. Market tops are often made when the reading is 0.6 or less. Note how reliable this is with respect to the February record low coinciding with the market high. Keep in mind this is also a contrarian indicator.

ECONOMIC UPDATES

Global Economic Indicators & Analysis:

Recapping Last Week

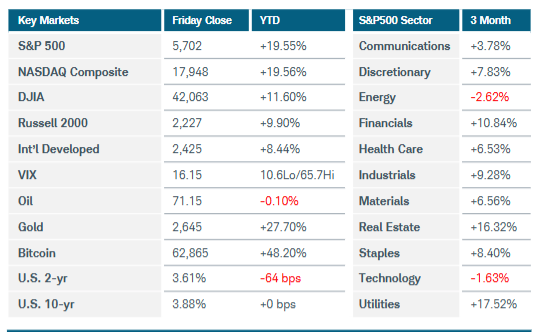
U.S. equities continued the prior week’s rally, reaching a new all-time high for both the S&P500 and the Dow Jones Industrial average. The Nasdaq-100 and Russell 2000 indices both posted solid performances as well, rising 1% and 2% respectively, but fell short of new all-time highs. The big story this week was Wednesday’s FOMC meeting. Everyone expected a rate cut was coming, but the devil was in the details. The FOMC opted for a 50bps cut versus 25 in an 11-1 vote and indicated another 50bps would be likely by the end of the year. Their Summary of Economic Projections report also revised down expectations for GDP and inflation. Stocks initially rallied but finished Wednesday’s session mostly unchanged. Thursday was more as expected with nearly all the week’s gains coming that day. Seven of eleven S&P 500 sectors were positive, led by energy, financials, and industrials with consumer staples and real estate falling behind, signaling a risk-on appetite to close out the week. Energy had a few positive catalysts, including geopolitical uncertainty in the Middle East stemming from exploding pagers, and the FOMC’s rate cut. The drop in the fed funds rate predictably put pressure on the U.S. dollar, which was supportive for other commodity prices, evidenced by oil and Bitcoin rallying between 2-5%. Yet, precious metals finished flat after posting large gains the week before. Other economic news in the U.S. was mostly positive starting with the Empire State Manufacturing index rising 16 points on Monday and the Philly Fed Index up 8.7 points Thursday, both newly into positive territory. Industrial production increased 0.8%, exceeding expectations, following a slide from the month prior due to Hurricane Beryl. The U.S. NAHB Housing Index beat expectations with participants noting the hope of lower interest rates on the horizon. Housing starts and permits rose 5% at the expense of existing home sales, which fell 2.5%. Lower rates are a bullish catalyst, but the median home price is still near all-time highs, deterring many potential buyers. Retail sales beat expectations along with an upward revision for July, and the good news continued Thursday with unemployment claims undercutting expectations.

On the international front, inflation and interest rates were also highly watched topics last week with CPI numbers and central bank meetings across the globe. Canada reached its 2% inflation target yet still plans to cut rates at each of its remaining 2024 meetings. In the U.K. consumer prices stayed flat, but services jumped 5.6%, leading the Bank of England to hold rates firm, and Japan followed suit holding rates steady after inflation met expectations, rising 2.8%. There were a few negative readings last week, starting with Germany’s ZEW Economic Sentiment falling from 19.2 to 3.6, reflecting the significant drop in German confidence and dragging Eurozone confidence down with it. China’s industrial output was the other negative mark, slowing to a 5-month low along with soft numbers in Chinese new home prices and retail sales.

This Week

This week kicks off with flash PMIs from all over the world, providing a glimpse into many areas like demand, employment, and price pressures. Australia, Germany, the U.K, the U.S, and Japan all release their purchasing managers index on Monday. All of those reports are expected to be very close to their previous readings, but the only ones above the 50-level, which indicates expansion, are out of the U.K. and services from the U.S. and Germany. Australia will give the rate statement that the rest of the world released last week the same day as their YoY CPI. A few different consumer confidence surveys will be released from Germany, and the U.S. is expecting numbers in line with recent reports. Fed Chairman Powell speaks on Thursday morning, but the most influential reports of the week will come Friday when U.S. core PCE and personal income and spending numbers are released. In July, PCE held unchanged and August’s expectations are no different, although they seem to be leveling off above the Fed’s long term target.

Call me if you have any questions. I am always happy to help!

John J. Gardner, CFP®, CPM®, AIF®

Blackhawk Wealth Advisors, Inc.

3860 Blackhawk Rd. Ste. 160 Danville, CA. 94506

Phone: 888-985-PLAN · Email: jg@blackhawkwealthadvisors.com

BLACKHAWKWEALTHADVISORS.COM

For my Market Monthly podcast, click on the link below. I provide a review of global stock market highlights over the past month and preview of the month ahead. Forward insights and perspectives are based on current financial market and economic trends with an emphasis on relevant developments in various areas from Fed policy to company earnings announcements.

Link to Market Monthly Podcast
810c9060-6bc9-4e20-948f-60bee7c1b0be image
dc6d6594-dfce-48b0-8d69-3a27db12748d image
7d2eabf6-51c8-425f-b667-128ed7bc0dd2 image

Blackhawk Wealth Advisors is the parent corporation of Equity Research & Portfolio Evaluation and Blackhawk Asset Management. It’s Chief Investment Officer is John J. Gardner. John is a Certified Financial Planner (CFP®) and Certified Portfolio Manager (CPM®). As an AIF®, John is also an Accredited Investment Fiduciary.

CUSTOMIZED. STRATEGIC. DYNAMIC.