


Bi-MONTHLY MARKET ANALYSIS &
ECONOMIC UPDATES
August 3, 2023
The Roaring 20’s 2.0

Something happened November 30, 2022 that now has Wall Street analysts predicting the return of the “Roaring 20’s”. That something that occurred last November 30 was the launch of AI chatbot ChatGPT for public use. Even though it has only been eight months, the Roaring 2020’s some analysts are calling for may be underway. Already since that launch, the S&P 500 has increased by $5 trillion, spending on technology has re-awakened after a post-pandemic hangover, the economy appears to be steering clear of a recession and previously persistent high inflation is cooling off. That single day provided the spark needed to ignite the stock market and it was a clear statement of generative AI’s transformative potential. On that day the S&P 500 shot up 3.1% as tech stocks with artificial intelligence products soared even more. OpenAI investor Microsoft leapt 6%, and AI chipmaker Nvidia spiked 8%. Google also jumped 6% and Meta Platforms (Facebook) ran up nearly 8%.
The high-expectation analysts share a vision of another $1 trillion spending on AI-related technology over the next decade and a far reaching positive economic impact. They say generative AI could bring a surge in productivity after a 17-year slump. This recently released technology is an immense source of optimism for economists looking forward. From all that I am reading, one take away is the increasing enthusiasm about AI’s potential to change the nature of our economy. The lightning-fast adoption of ChatGPT, which gained its first 100 million users in a record-shattering two months, partly explains the conviction that the U.S. is on the cusp of a productivity boom. The consensus is that generative AI will change the world. The expected increased investment in technology spurred by generative AI supports the case for a secular bull market that’s comparable to the Roaring 1920s.
Boom to Bubble?
Many investors today have vivid memories of the “Dot-Com Boom” of the 1990’s that led to the bubble-bursting end of that market mania in early 2000. Stock market history dating back to the days when speculators traded tulip bulbs is a reliable reminder that the boom-bust cycle is normal. The current early innings AI craze is likely to end with a popped bubble, but that could be later than sooner. It’s a matter of when, not if, the AI boom goes bust in the investment markets. It happens every time – over and over again. Qualcomm was one of the many companies to zoom up to remarkable price levels during the Dot-Com boom, and one of the few to survive the bust. It soared from $4 to $100 in 1999. It then fell to about $11 at the bottom of the post-boom Nasdaq crash in mid-2002 and did not fight its way back up to $100 until July of 2020. Fact is many more investors paid closer to $100 than $4, so most had to wait over 20 years to just break even. The “Super 7” stocks leading the current AI boom are highly likely to experience parabolic price runs before returning to earth much like Qualcomm of 1999. There’s no bubble to prick now, as the AI boom is in its first year. However, it will be the wise investor who manages the new roaring 20’s tech boom prudently, unemotionally and avoids buying high and selling low.
AI By the Numbers…
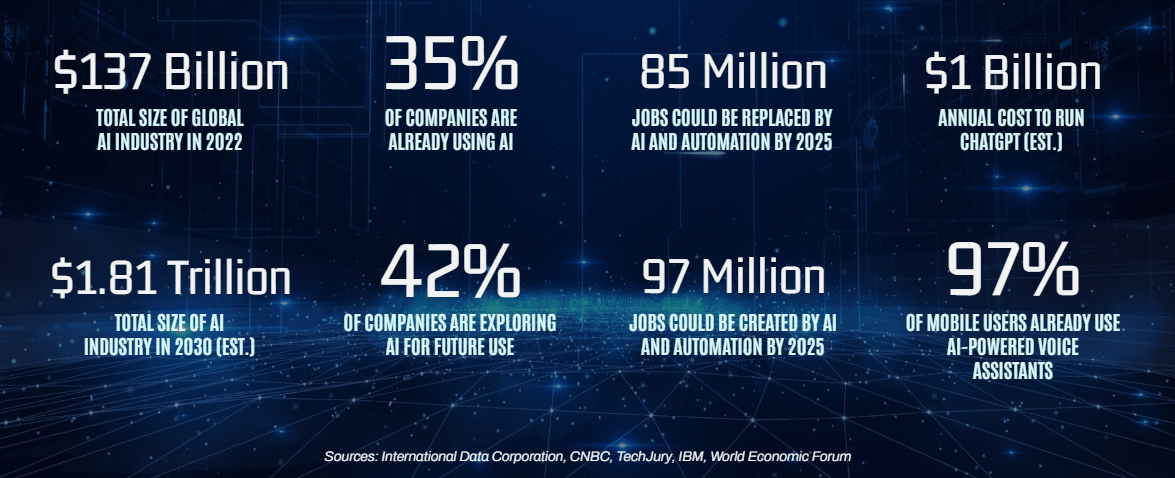
TAKING PERSPECTIVE…
Proper Perspective: In our hectic and often hard to comprehend world, it is very easy to lose perspective. You may agree it is sometimes difficult to see the big picture. The media often doesn’t help with this, but unfortunately instead encourages us to see things in a most negative light. Here is hopefully a pause to gain positive perspective.

Famous Quote On This Day: “I want to be an artist, an actress with integrity.”
~~ Marilyn Monroe, 1962
What Happened On This Day, August 3, 1934 – Adolf Hitler becomes Fuhrer (leader).
MARKET ANALYSIS
INDICATORS OF INTEREST:
- Market’s Current Signal: Uptrend Under Pressure. Analysis of the stock market over 130 years of history shows we can view it in terms of three stages – market in uptrend, uptrend under pressure and market correction. I analogize this to a traffic signal’s changing colors from green to yellow and then to red. Since the 1880’s, this perspective has led to investment out-performance relative to market indexes. This is due to trend analysis which determines risk reducing, return enhancing market entry and exit points. The U.S. stock market’s current signal is Uptrend Under Pressure.
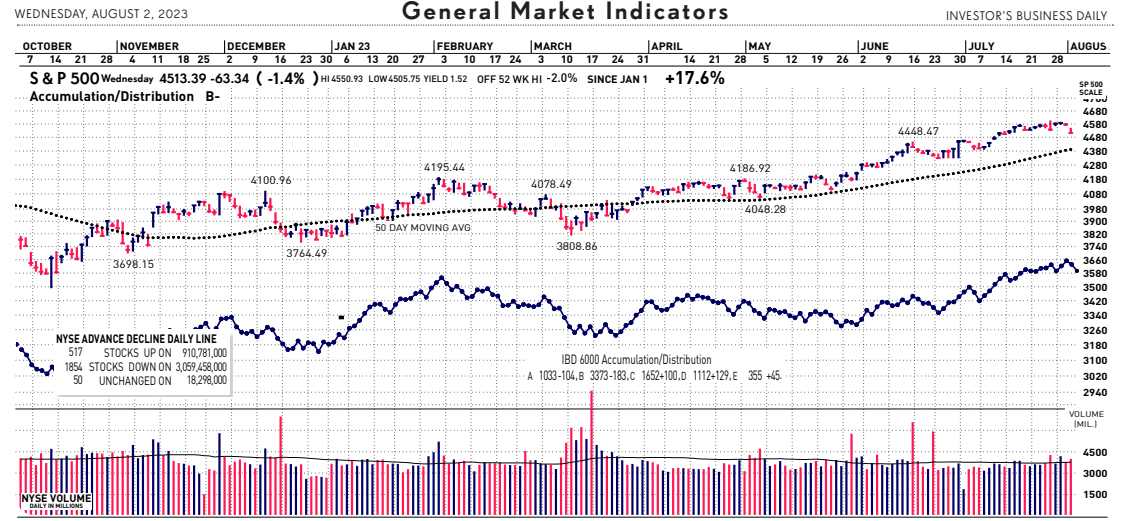
The Stock Market Trend: Uptrend Under Pressure. After the regional banking crisis in mid-March, the general market weakened to Market in Correction March 15. In a resilient rally, the trend turned bullish with a signal change to Market in Confirmed Uptrend on March 29. That trend signal flashed caution and indicated weakness on April 25 as the market’s trend changed to Uptrend Under Pressure. Then, on May 10 the market’s trend changed again, to Confirmed Uptrend. The broad market remained in a Confirmed Uptrend until yesterday. The steep, broad and high volume bearish sell-off yesterday caused a weaker stock market trend outlook to Uptrend Under Pressure. Bull markets are not immune to sharp, temporary sell-offs. In a nutshell, sharp drops in heavier turnover in the stock market like the one yesterday deliver the earliest signs that the bull run is suffering from fatigue.
Here are key market levels as of Monday, August 3:
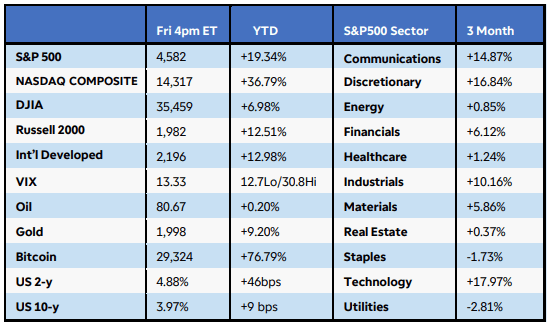
Recapping Last Week
U.S. equities rose as investors assessed better-than-expected economic data, central bank actions, and the latest batch of corporate earnings. The Nasdaq Composite gained over2%, while the S&P500 and Russell 2000 added 1%+. Seven of 11 S&P500 sectors gained ground, led by a 5% jump in communications. Strong revenue and earnings growth at Meta, Microsoft, and Alphabet were fueled by a pickup in advertising and cloud storage. Crude oil prices soared 5% as the global demand forecast improved, sending energy stocks higher despite disappointing earnings from giants Exxon Mobil and Chevron. The first estimate of U.S. Q2 GDP growth came in above estimates at 2.4%, powered by solid consumer spending, while inflation cooled further in June. The Core PCE Index increased just 0.2% month-over-month, and the year-over-year gain of 4.1% was the lowest since September 2021. Compensation costs rose less than expected, fueling hopes that the Fed’s 25bps rate hike at last week’s meeting may be the last in this cycle. Treasury yields lifted as the economic data showed continued improvement. Consumer confidence reached a two-year high in July, while durable goods orders for June rose a much better than-expected 4.7%. Weekly jobless claims sank to 221K, while evidence of a bottoming housing market emerged. Pending home sales increased in June for the first time in 4 months, although new homes sales were hampered by high borrowing costs.
Internationally, global PMIs stayed in expansion in the U.S. but showed signs of weakening business activity in the UK and Europe. The European Central Bank raised rates for a ninth consecutive time, but sentiment is shifting towards a pause. German inflation fell in July and business sentiment dropped for a third straight month as recession fears persisted. Australia’s CPI slowed to 6% in the June quarter from 7% prior. Lastly, the Bank of Japan surprised markets by loosening its yield curve control, expanding the range for 10-year bonds to 100bps from 50bps around the 0% target.
Current View
Yesterday, as I mentioned above, crack in the bull’s armor. The Nasdaq posted its biggest single-session drop in more than five months on yesterday, and volume rose sharply. Of the197 industry groups I monitor daily, more than 20 groups fell 3% or more yesterday. This bearish action was enough to trigger a weaker stock market trend outlook to Uptrend Under Pressure. While earnings reports certainly deserved much of the blame, perhaps the primary catalyst for the stock market drop came from the bond markets. In an unexpected announcement Tuesday night, Fitch Ratings downgraded U.S. Treasury securities. The bond rating agency lowered its view on U.S. government debt from a top-rating triple-A grade to AA+. Treasury Secretary Janet Yellen, a former chair of the Federal Reserve, called the decision “arbitrary” and based on “outdated data.” Still, the stock market sold off hard. The last time U.S. debt securities were hit with a credit rating downgrade was 12 years ago, August 5, 2011. On the next trading day, the S&P 500 index suffered a 6.66% sell-off. That marked its worst single-session decline since Dec. 1, 2008. So, the mauling in the stock market yesterday was not as terrible. Yet the losses among some growth stocks was quite brutal.
Bull:Bear Barometer
As I been discussing with clients recently, “It’s so bullish, it’s bearish”. Keeping an eye on investor sentiment is helpful for a reliable indicator of major direction changes in the stock market. Excessive optimism can hint at a growing absence of fresh new buyers to help propel stocks higher and has historically preceded market tops. The current weekly Investors Intelligence survey, which I note below, showed bulls as a percentage of all newsletter editors polled increasing to 57.1% yesterday vs. 55.6% last week. That’s not only just under the November 2021 peak reading of 57.2%, but it now exceeds the 55% initial caution level, which says to prepare a more defensive strategy. Bears fell to 18.6% after a small rebound to 19.4% last week.
- Industry Group Strength: BULLISH. As of yesterday, 123 out the 197 groups I monitor are up year-to-date. 74 are down.
- New Highs vs. New Lows: BEARISH. In yesterday’s session, there were 106 new 52-week highs and 109 new 52-week lows.
- Dow Dividend Yield: BEARISH. The current yield for the Dow Jones Industrial Average is 2.14%. The 10-year Treasury now 4.17%.
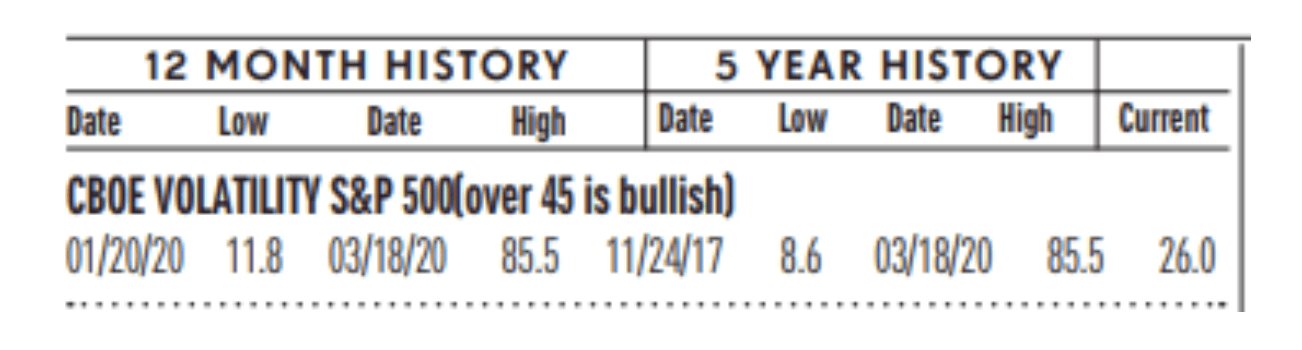
- Volatility Index: BEARISH. Volatility has been volatile. The “VIX” is now 16, up from 14 two weeks ago. It is now at its lowest level since February 20, of 2020. The index is also known as the “Fear Index.” It is considered a contrarian indicator and therefore viewed as bullish as it rises indicating investors are becoming more fearful. The VIX:
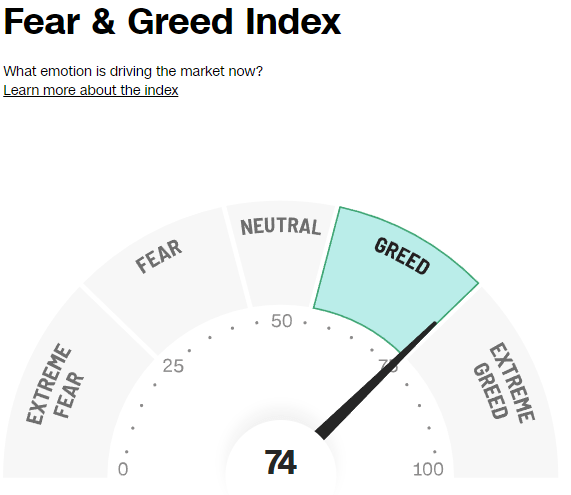
- Fear / Greed Index: BEARISH. Investors are driven by two emotions: fear and greed. Too much fear can create a condition of oversold/ undervalued stock prices. Too much greed can result in overbought/overvalued stock prices. The AAII Investor Sentiment Index is now neutral. BE FEARFUL WHEN OTHERS ARE GREEDY. At 74, the Fear & Greed Index is up from 81 two weeks ago.
- Bull / Bear Barometer: BEARISH. This secondary market indicator should also be viewed with a contrarian perspective. As of yesterday, according to the latest survey of stock market newsletter writers by Investor’s Intelligence, bullish sentiment is 57.1% and the bears came in at 18.6%. Bullish sentiment is up from 54.3 two weeks ago, while the bearish read is down from 20.1% in the last two weeks. Consider this a contrarian indicator because the crowd is often wrong at market tops and bottoms. In other words, extreme bullishness has been seen near several market tops in the past, while extreme bearishness has been seen at market bottoms.
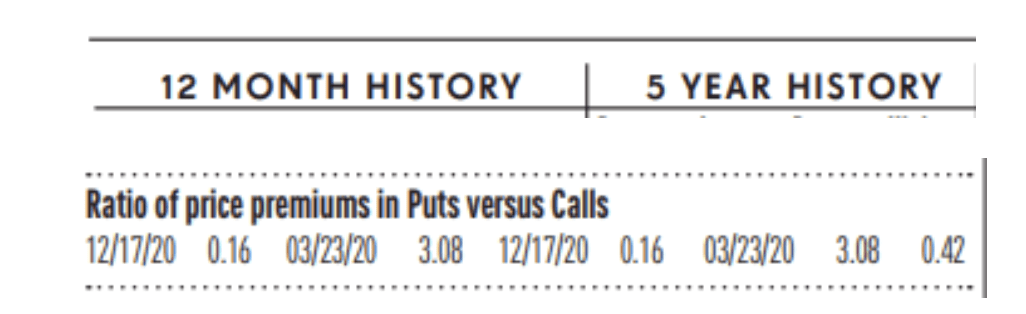
- Put / Call Ratio: BEARISH. The ratio of put-to-call options is 0.32, up from 0.18 two weeks ago. The put-call ratio tracks the mood of what options investors are doing, not just saying. They typically buy puts if they think a stock will decline and calls if they think it will rise. If they’re buying lots of puts, they see the market declining. And if they’re loading up on calls, they’re generally bullish. Historically, market bottoms occurred when the reading spikes to 1.2 or more. Market tops are often made when the reading is 0.6 or less. Note how reliable this is with respect to the February record low coinciding with the market high. Keep in mind this is also a contrarian indicator.
ECONOMIC UPDATES
Global Economic Indicators & Analysis:
POSITIVE INDICATORS
Consumer Confidence Climbs: A survey of U.S. consumer confidence climbed to a two-year high of 117.0 in July, a sign that Americans are growing more optimistic about the economy. Consumer confidence tends to signal whether the economy is getting better or worse. The index has rebounded from a weak spell early in the year, though it still lags well below pre-pandemic levels. Unemployment is near the lowest level since the 1960s and wages have risen more rapidly to help offset some of the inflation pain. As a result, households are spending enough money to stave off a widely predicted recession.
GDP Increases, Economy Resilient: GDP is mostly a look in the rear-view mirror, but what it shows is that the U.S. economy has faced fewer roadblocks than expected. The economy is still expanding in the face of rising interest rates. Most Americans who want a job have one and their wages are going up, too. Not enough to ease the pain of inflation, but enough to help pay the bills and keep the economy out of recession. A resilient U.S. economy grew at a 2.4% annual pace in the second quarter, propelled by steady consumer spending and a rebound in business investment. Wall Street analysts had forecast a 2% increase in gross domestic product, the official scorecard for the economy. GDP had expanded 2% in the first quarter. The economy has shown remarkable endurance this year despite high inflation and rising interest rates, pushing out widespread forecasts of a recession until 2024. Some economists, including those at the Federal Reserve, even think the U.S. might avoid one altogether.
Consumer Spending Climbs, US Economy Confident: Consumer spending rose 0.5% in June in a sign of confidence in the economy as inflation eased again and the U.S. continued to grow. Consumer spending is the main engine of the U.S. economy. Households increased spending by a 1.6% annual pace in the second quarter running from April to June. Outlays have risen seven months in a row. A strong jobs market marked by low unemployment and rising wages have given Americans the confidence to spend more than enough to keep the economy growing. Services such as dining out, travel and recreation have especially benefited. Most economists predict spending will slow, however, as rising interest rates take a bigger bite out of the economy. Whether that’s enough to eventually tip the U.S. into recession is far from clear.
PCE Eases Again: Inflation has slowed a lot this year due to falling energy and food prices, but the cost of living is still rising too fast to mollify the Fed or ease the financial pain of U.S. households. The Fed is expected to keep interest rates high through next year to bring inflation down closer to its 2% target. The danger is that higher borrowing costs could also slow the economy enough to tip the U.S. into recession. The latest PCE report is likely to give the Fed more reason for optimism, however. The rate of core inflation over the past year slowed a bit less to 4.1% from 4.6% in the prior month, but that still puts it at a more than two-year low. It’s still far above the Fed’s 2% target, however.
Consumer-Sentiment Hits 22-Month High: The consumer-sentiment survey reveals how consumers feel about their own finances as well as the broader economy. A survey of consumer sentiment survey reached a 22-month high of 71.6 in July, helped by a slowdown in inflation and a robust jobs market. Americans are less worried about a recession. Unemployment is low, wages are rising and inflation has eased. Yet the economy is likely to face more turbulence ahead because of higher interest rates orchestrated by the Federal Reserve to bring inflation down even further.
WEAK INDICATORS
Feds Raise Rates Again: The Federal Reserve on last Wednesday raised its benchmark interest rate by a quarter of a percentage point to a 22-year high and signaled it is prepared to do more to bring “elevated” inflation down. The decision boosts the Fed’s benchmark interest rate to a range of 5.25% to 5.5%, the highest the Fed target rate has been since 2001. “We remain committed to bringing inflation back to our 2% goal,” Chair Jerome Powell said in a press conference after the Fed rate hike. “No one should doubt that.”
S&P U.S. Manufacturing PMI: July is seeing an unwelcome combination of slower economic growth, weaker job creation, gloomier business confidence and sticky inflation. The U.S. economy grew at the slowest pace in five months in July, a pair of S&P surveys showed, and pointed to weaker conditions later in the year. New orders, a sign of demand, rose slightly but were relatively soft. Hiring was also the weakest since January. The large service side of the economy is keeping the U.S. forging ahead, but it might be losing some steam. The Federal Reserve is expected to raise interest rates again this week, and higher borrowing costs have trimmed the sails of the economy. Prices continued to rise for both raw materials and labor.
US Home Sales Down Slightly : Sales of newly built homes in the U.S. fell in June, as demand cooled after a jump the previous month. U.S. new-home sales fell 2.5% to an annual rate of 697,000 in June, from a revised 715,000 in the prior month, the Commerce Department reported last Wednesday. Sales fell further than what Wall Street was expecting. Economists had forecast new-home sales to total 725,000 in June. A lack of previously owned homes for sale has pushed many home buyers into the new-home market, but high mortgage rates may dampen demand. Overall, new-home sales have been higher because home builders are among the few players offering inventory for home buyers.
ISM Services Softening but Still Resilient : A measure of business conditions for service sector companies like hotels, restaurants and hair salons slowed in July, but still signaled an expanding economy. Demand for services has been strong in the aftermath of the pandemic. People’s desire to travel and go to restaurants has been a balancing force while the industrial side of the economy remains stuck.
Slump at US Factories Continues: A barometer of business conditions at American factories rose slightly in July but remained at depressed levels, indicating little improvement in the industrial side of the economy. ISM manufacturing index still in contractionary territory at 46.4%. Numbers below 50% signal contraction. The index has been negative for nine months in a row, a dubious streak last matched during the 2007-2009 Great Recession. The industrial side of the economy is unlikely to make a recovery until the Federal Reserve stops raising interest rates or the threat of recession passes.
An easy way to get my ERPE Excerpts is by “text-to-subscribe”. By simply texting to the number 22828 and entering the word erpe excerpts, a prompt is sent to enter an email address and done! You will then receive my bi-monthly market and economic updates. Please pass this on.
Call me if you have any questions. I am always happy to help!
John J. Gardner, CFP®, CPM®.
Blackhawk Wealth Advisors, Inc.
4125 Blackhawk Plaza Circle, Ste. 260 Danville, CA. 94506
Phone: 888-985-PLAN ·
Email: jg@blackhawkwealthadvisors.com
BLACKHAWKWEALTHADVISORS.COM
For my Market Monthly podcast, click on the link below. I provide a review of global stock market highlights over the past month and preview of the month ahead. Forward insights and perspectives are based on current financial market and economic trends with an emphasis on relevant developments in various areas from Fed policy to company earnings announcements.