

Bi-MONTHLY MARKET ANALYSIS &
ECONOMIC UPDATES
July 20, 2023
Promises and Perils of AI

At least for now, the most widely used AI (artificial intelligence) tool is ChatGPT. Soon after its release last November by San Francisco-based Open AI, it became the fastest-growing app ever, taking only two months to reach 100 million users. For perspective, it took TikTok nine months and Spotify 55 months to hit the same milestone. ChatGPT is essentially a product of “machine learning”, as it draws on vast data sets and can have humanlike conversations with users that enable it to perform a wide variety of tasks, such as writing computer code, summarizing documents and composing essays. Its explosive growth continues despite the technology’s potentially serious and dangerous outcomes. It’s only as good as the data it has been given, and the information can be incorrect, biased, racist, proprietary or copyrighted. Imagine the unintended consequences….
“AI has the potential to bring about many benefits, but there are also concerns that need to be addressed. These include:
- Militarization of AI and the Impact of Autonomous Weapons
- Massive Unemployment Due to Automation
- Social Manipulation Using AI
- Discrimination and Bias in AI
- Privacy and market concentration, safety and exploitability are also challenges that AI needs to overcome.
AI can be used in many positive ways — to foster innovation, increase efficiency, improve development, and enhance consumer experience. However, it is important to address these concerns so that we can ensure that AI is used for good.”
Now for full disclosure and a real example of ChatGPT – – the paragraph above is a word-for-word response I got when prompting ChatGPT for: what are the biggest promises and perils of ai? It kindly offered me in closing, “Is there anything else I can help you with?” It was as easy to get that information as any ordinary “google” search. Immediate and thorough feedback, and friendly. Could sure have used that in college!
When applying myself more to researching the potential good and bad of AI, I learned much more. But, it took much more time and was not as easy. A major take-away from a brief study of AI is there is a real concern that the risks may outweigh the rewards. The most alarming downside of AI, which at first thought seems absurd, is the notion that AI could eliminate humanity. A University of Oxford professor of machine learning said the most concerning possibility of AI is that it could threaten our survival as a species. He does say, though, that AI is one of the few practical technologies that may allow us to re-engineer our economies wholesale to achieve Net Zero by using AI to help to predict intermittent renewable energy sources (like solar, tide and wind).
Concerns, cautions and controls
In March, more than 1,000 industry leaders and visionaries, including Elon Musk, and Steve Wozniak, co-founder of Apple, called on AI companies to pause developing new versions of the technology for six months. Musk co-founded Open AI in 2015 and left three years later after clashing with management. He’s now building a new company to compete with ChatGPT. In April, the U.S. Commerce Department asked the public for comments on potential accountability measures and policies to ensure that AI systems are legal, effective, ethical, safe and otherwise trustworthy. The agency said it would issue a report after examining the responses. As a result, AI companies have publicly agreed to the pause. And four other federal agencies recently pledged to collaborate closely to prevent discrimination resulting from the use of AI and automated decision tools in the workplace. Exercising more controls, authorities in Italy, citing privacy concerns, banned the technology. Italy is the only Western country to adopt that stance, though a handful of other nations, including Russia, China and Syria, forbid its use.
For sure there are promises and perils inherent in the future of AI. Consensus view is that AI’s development is a good thing and a large step in technological advancement. When the cellphone was first released, it was not popular, and was not largely adopted until almost 20 years after its invention. People said it would destroy society as we know it, but here we are 50 years later, and the world has not ended. Overall, artificial intelligence is the latest step in tech advancement. In a little under two years chatbots, artbots, and other AI tools have grown exponentially in both their ability to learn and the quality of their outputs. Most recently on March 14th, 2023, GPT4 was released. AI will likely continue to become a useful part of society in the near future. Let’s hope the benefits of AI outweigh the risks.
TAKING PERSPECTIVE…
Proper Perspective: In our hectic and often hard to comprehend world, it is very easy to lose perspective. You may agree it is sometimes difficult to see the big picture. The media often doesn’t help with this, but unfortunately instead encourages us to see things in a most negative light. Here is hopefully a pause to gain positive perspective.

Famous Quote On This Day: “That’s one small step for man, one giant leap for mankind.”
~ ~ Neil Armstrong, 1969
What Happened On This Day, July 20, 1976 – Viking 1 successfully lands on Mars.
MARKET ANALYSIS
INDICATORS OF INTEREST:
- Market’s Current Signal: Confirmed Uptrend. Analysis of the stock market over 130 years of history shows we can view it in terms of three stages – market in uptrend, uptrend under pressure and market correction. I analogize this to a traffic signal’s changing colors from green to yellow and then to red. Since the 1880’s, this perspective has led to investment out-performance relative to market indexes. This is due to trend analysis which determines risk reducing, return enhancing market entry and exit points. The U.S. stock market’s current signal is Confirmed Uptrend.

The Stock Market Trend: Confirmed Uptrend. After the regional banking crisis in mid-March, the general market weakened to Market in Correction March 15. In a resilient rally, the trend turned bullish with a signal change to Market in Confirmed Uptrend on March 29. That trend signal flashed caution and indicated weakness on April 25 as the market’s trend changed to Uptrend Under Pressure. Then, on May 10 the market’s trend changed again, to Confirmed Uptrend. The broad market remains in that uptrend.
Here are key market levels as of Monday, July 17:
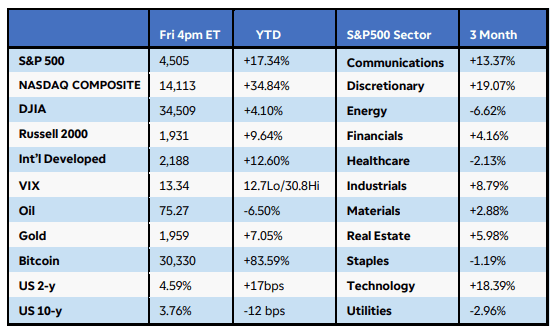
Recapping Last Week
U.S. equities rallied last week, responding to encouraging inflation data and several earnings reports beating expectations. The S&P500 Index gained 2.5%, while the Nasdaq Composite and Russell 2000 jumped 3.5%. As good as that was, international stocks tracked by the MSCI EAFE Index outperformed, gaining nearly 5%. All 11 S&P500 sectors rose, with communications and discretionary continuing to lead with 3.5% gains each. Earnings season kicked off on a positive note with JP Morgan, United Healthcare, and Wells Fargo all beating expectations and adding confidence to the banking sector that has had a rough start to the year. State Street Corp. was on the losing end, falling 12% on weaker revenue. U.S consumer credit expansion surprised to the downside at $7.2 billion versus $20.3 billion in April. As I noted above, both consumer and producer price growth came in lower, confirming inflation deceleration and adding hope for an end to the Fed’s tightening cycle. Expectations on short-term inflation eased as well in the New York Fed Survey to a two-year low and U.S. import prices fell again in June. Interest rates pulled back with 10- and 30-year treasuries dropping 23bps and 11bps respectively, pulling the U.S. Dollar Index down over 2%. This helped lift precious metals higher, with gold gaining 1.5% and silver rising 8% for the week. U.S. unemployment claims fell and small business confidence and consumer sentiment showed further strength.
Internationally, the UK’s higher-than-expected claimant count eased fears of extreme rate hikes overseas, suggesting wages are near the peak, and monthly GDP contracted 0.1%. The Bank of Canada did however hike its overnight rate to 5%, still fearing further inflation. In China data showed different concerns, with a 5.4% drop in producer prices year-over-year along with falling exports adding pressure for new stimulus. In the Eurozone, Germany’s ZEW sentiment and the EU Sentix Investor Confidence reports both dropped to -14.7 and -22.5 respectively. Australia’s NAB business confidence report declined as well but not as severely.
Current View
Through yesterday, the Dow scored an 8-straight up days. Thanks largely of JNJ’s positive reaction to earnings, the Dow is on its way to a 9th gain in a row. This is bullish, as the narrow market narrative is being put to rest with broadening market strength. The Dow has just begin to play a little catch-up as it has significantly lagged the market. Through yesterday, it is up just 5.8% year-to-date. For perspective on how far growth has outperformed value stocks, the Nasdaq is up over 37% ytd through yesterday.
So far, the Q2 earnings season has been well received; especially in the banking sector. Today, though, mega-cap tech and growth stocks like Netflix and Tesla are selling off hard on their earnings reports.
The seldom mentioned, yet important, Dow Jones transportation average now stands just 11% below its all-time peak of 18,246 set in early November 2021. This action may reaffirm market observers’ view that the U.S. may avoid a hard landing in the economy. With 4.7% boost over the above-noted eight-session time frame, the sector index is now above the 16,300 level, something that has not happened since March last year.
While the U.S. stock market remains in a confirmed uptrend, we must stay diligent in watching for an approaching bear. Earnings season, as I noted above, is now underway. Summer doldrums could set into Wall Street. So, what should investors be looking for that would indicate the tide is becoming bearish? First, keep an eye on instances of heavy institutional selling. Bear markets begin when top growth stocks fall en masse in a fury of volume. Also, as I mentioned above, some of this is happening this morning. As I always close out my monthly Market Monthly podcast, “Proper Portfolio Planning Promotes Positive Performance.” This requires constant monitoring and prudent portfolio management.
- Industry Group Strength: BULLISH. As of yesterday, 121 out the 197 groups I monitor are up year-to-date. 76 are down.
- New Highs vs. New Lows: BULLISH. In yesterday’s session, there were 409 new 52-week highs and 38 new 52-week lows.
- Dow Dividend Yield: BEARISH. The current yield for the Dow Jones Industrial Average is 2.19%. The 10-year Treasury now 3.87%.
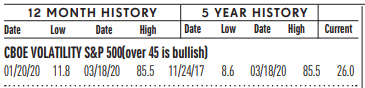
- Volatility Index: BEARISH. Volatility has been volatile. The “VIX” is now 14, same as two weeks ago. It is now at its lowest level since February 20, of 2020. The index is also known as the “Fear Index.” It is considered a contrarian indicator and therefore viewed as bullish as it rises indicating investors are becoming more fearful. The VIX:
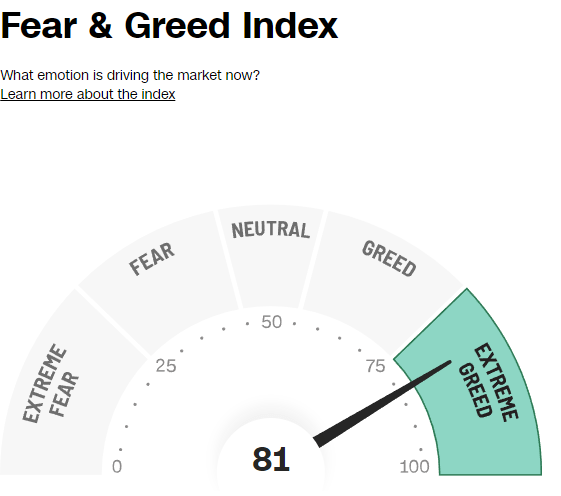
- Fear / Greed Index: BEARISH. Investors are driven by two emotions: fear and greed. Too much fear can create a condition of oversold/ undervalued stock prices. Too much greed can result in overbought/overvalued stock prices. The AAII Investor Sentiment Index is now neutral. BE FEARFUL WHEN OTHERS ARE GREEDY. At 81, the Fear & Greed Index is up from 80 two weeks ago.
- Bull / Bear Barometer: BEARISH. This secondary market indicator should also be viewed with a contrarian perspective. As of yesterday, according to the latest survey of stock market newsletter writers by Investor’s Intelligence, bullish sentiment is 54.3% and the bears came in at 18%. Bullish sentiment is about the same while the bearish read is down from 21.6% in the last two weeks. Consider this a contrarian indicator because the crowd is often wrong at market tops and bottoms. In other words, extreme bullishness has been seen near several market tops in the past, while extreme bearishness has been seen at market bottoms.
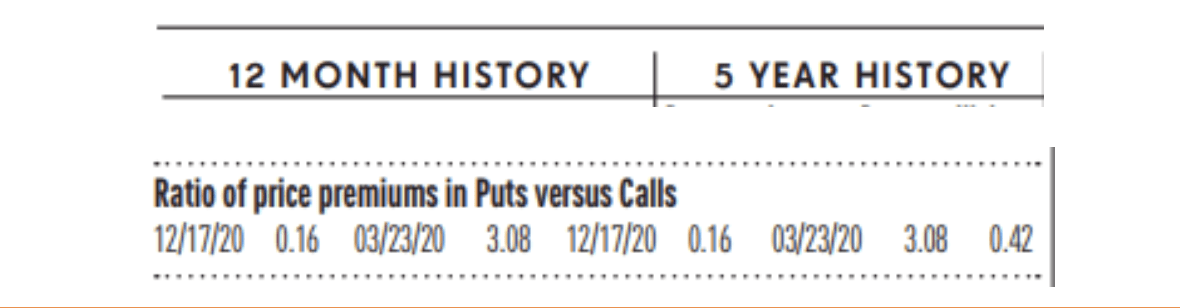
- Put / Call Ratio: BEARISH. The ratio of put-to-call options is 0.18, down from 0.34 two weeks ago. The put-call ratio tracks the mood of what options investors are doing, not just saying. They typically buy puts if they think a stock will decline and calls if they think it will rise. If they’re buying lots of puts, they see the market declining. And if they’re loading up on calls, they’re generally bullish. Historically, market bottoms occurred when the reading spikes to 1.2 or more. Market tops are often made when the reading is 0.6 or less. Note how reliable this is with respect to the February record low coinciding with the market high. Keep in mind this is also a contrarian indicator.
ECONOMIC UPDATES
Global Economic Indicators & Analysis:
POSITIVE INDICATORS
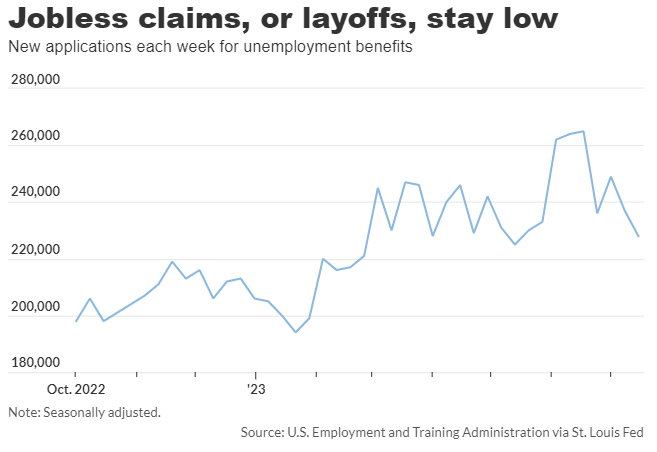
Jobless Claims Down: Jobless claims drop to two-month low of 228,000, as labor market is still going strong. New jobless claims declined by 9,000 from 237,000 in the prior week, the government said today. Unemployment claims typically rise when the economy weakens and a recession approaches. Claims have risen this year from historic lows, but the job market is still quite sturdy. The economy has added 1.7 million jobs in the first half of the year.
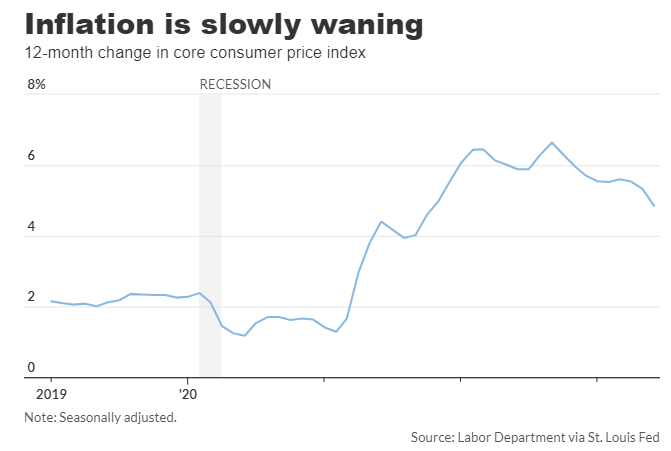
CPI Down: U.S. consumer prices rose a modest 0.2% in June and the rate of inflation slowed to the lowest level since 2021, but recent progress might not be enough to stop the Federal Reserve from raising interest rates soon. The increase in consumer prices last month was smaller than the 0.3% forecast of economists polled by the Wall Street Journal. The yearly rate of inflation decelerated to 3% from 4% in the prior month. The last time inflation was that low was in March 2021.
PPI Down: The PPI report captures what companies pay for supplies such as fuel, packaging and so forth. These costs are often passed on to customers at the retail level and give an idea of whether inflation is rising or falling. Wholesale prices have slowed even faster this year than consumer prices, perhaps a sign that inflation will retreat faster than the Fed expected. U.S. wholesale prices rose a meek 0.1% in June and no longer appear to be going up, suggesting that inflation is likely to continue to decelerate. Wholesale costs often foretell future inflation trends. The increase in wholesale prices over the past 12 months slowed to 0.1% from 1.1% in the prior month, which is the lowest reading since September 2020.

Retail Sales Adjust, Still Up: Sales at retailers rose a tepid 0.2% in June, reflecting a shift in consumer spending habits and signaling softness in some parts of the U.S. economy. Retail sales represent about one-third of all consumer spending and usually offer clues on the strength of the economy. However, the retail report has recently been less reliable as a bellwether, because Americans are spending more on services than they are on goods. Retailers mostly sell goods. Overall consumer spending is still fairly strong. Retailers showed widely varying results. Sales rose sharply at stores that sell furniture and electronics. Internet retailers also saw a big boost in sales. Yet sales sank at home centers, department stores and gas stations. Retail sales have leveled off after explosive growth in 2021 and 2022, when U.S. consumers bought huge amounts of consumer goods such as computers, cell phones and office equipment. Since then, households have shifted to services they shunned during the pandemic. They are traveling more, booking hotels, dining out and spending a lot on recreation. Total consumer spending is still rising faster than inflation and keeping the economy out of recession for now.
Import Prices Down: The cost of U.S. imported goods fell 0.2% in June and On a year-on-year basis, import prices are down 6.1%, the largest drop since May 202O. Import prices are down 6.1%, the largest drop since May 2020. Import prices have fallen every month of the year except April. U.S. inflation is moderating, helped in part by commodity prices. Energy had been leading the decline but now non-fuel prices are weakening. Given the soft inflation readings in June, economists are starting to believe that the Fed will only raise interest rates one more time in July.
Consumer Sentiment Up: The University of Michigan’s gauge of consumer sentiment rose to a preliminary July reading of 72.6 from a June reading of 64.4. It is the largest gain since December 2005. Sentiment is at its highest level since September 2021. Sentiment is improving as gasoline prices have held steady this summer. Low unemployment is also playing a role.
Home Builder Confidence: A persistent shortage of previously owned homes for sale is fueling builders’ optimism, with a key indicator of their confidence rising for the seventh month in a row in July. With mortgage rates at nearly 7%, many homeowners were finding little incentive to sell, and new listings were down 27% from a year ago, according to Realtor.com. That has boosted interest in new homes and given builders reason to remain confident about their outlook. For the last few months, new homes have been a bright spot in the housing market, as builders are able to meet home-buying demand amid a scarcity of listings of previously owned homes. But builders were also worried about how much longer they can keep up, as they said they foresee possible speed bumps that may slow construction, such as a shortage of lots to build homes on as well as a lack of electrical-transformer equipment. They were also worried about mortgage-interest rates rising to 7% and how that could affect demand.
WEAK INDICATORS
LEI Down: Today’s report on the leading economic index showed a drop of 0.7% in June, falling for the 15th month in a row, a recession signal if there ever was one. But the U.S. economy is still growing and shows few signs of a pending slump. The leading index is a gauge of 10 indicators designed to show whether the economy is getting better or worse. Seven of the 10 indicators fell in June. Economists polled by the Wall Street Journal had forecast a 0.6% drop. The last time the leading index dropped for so many months in a row was in 2007-08, when the U.S. fell into the Great Recession.
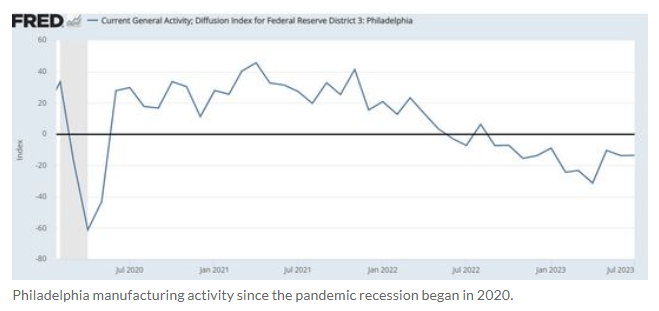
Philly Fed Index Up: The Philadelphia Fed said today its gauge of regional business activity inched up to negative 13.5 in July from negative 13.7 in the previous month. Any reading below zero indicates deteriorating conditions. This is the 11th straight negative reading. Economists polled by the Wall Street Journal expected a reading of negative 10 in July. The barometer on new orders fell 4.9 points to negative 15.9 in July. The shipments index fell 22.4 points to negative 12.5.The prices-received index jumped to 23 in July — the highest level since January — from near zero in the previous month. One bright spot was that the measure of the six-month business outlook rose to 29.1 in July, the highest reading since August 2021. As the chart below shows, the Philadelphia index is showing slightly better results than the recent trend. It had averaged negative 15.5 over the last 10 months.
US Deficit Unsustainable: Federal Reserve officials say that the government’s finances are on a long-term unsustainable path, but there is little appetite in Congress to fix it. For the first nine months of the fiscal year, the deficit was $1.39 trillion, up from $515.1 billion in the same period last year.
Consumer Credit Softening: U.S. consumers have spent at an above-trend pace over the past couple of years and economists are watching the data closely for signs of strains on household balance sheets. Many economists think that the top income earners are still spending but many other households are pulling back. We expect consumer credit growth to continue to slow in the second half of 2023, with revolving credit experiencing a more pronounced slowdown. We anticipate record-high rates on credit cards, more restrictive lending standards and a softening labor market will lead consumers to curtail their borrowing.
Industrial Production Down: U.S. manufacturing sector is in a ‘sorry state’ U.S. industrial production fell 0.5% in June, with declines in most market groups, the Federal Reserve reported Tuesday. The decline was below expectations of a flat reading, according to a survey of economists by The Wall Street Journal. “The upshot here is that most of the manufacturing sector remains in a sorry state, and we see few signs of help on the horizon. The post-zero-Covid rebound in China’s manufacturing sector already has fizzled out, and an aggressive fiscal response by the Chinese authorities is extremely unlikely. Domestic U.S. capital spending, meanwhile, is suffering under the weight of significantly higher borrowing costs, though capital spending intentions in the regional Fed manufacturing surveys might have bottomed,” said Kieran Clancy, senior U.S. economist at Pantheon Macroeconomics.
Existing Home Sales Down: A persistent lack of homes for sale combined with strong home-buying demand pushed home prices up in June to the highest level in a year. The total number of homes for sale in June fell by 13.6% from last June, to 1.08 million units. Sales of previously owned homes fell by 3.3% to an annual rate of 4.16 million in June, the National Association of Realtors said today. The median price for an existing home in June was $410,200, which is the second-highest price that the NAR has recorded since it began tracking the data in 1999. Home prices peaked in June last year, when the median price of a resale home hit $413,800.
An easy way to get my ERPE Excerpts is by “text-to-subscribe”. By simply texting to the number 22828 and entering the word erpe excerpts, a prompt is sent to enter an email address and done! You will then receive my bi-monthly market and economic updates. Please pass this on.
Call me if you have any questions. I am always happy to help!
John J. Gardner, CFP®, CPM®.
Blackhawk Wealth Advisors, Inc.
4125 Blackhawk Plaza Circle, Ste. 260 Danville, CA. 94506
Phone: 888-985-PLAN ·
Email: jg@blackhawkwealthadvisors.com
BLACKHAWKWEALTHADVISORS.COM
For my Market Monthly podcast, click on the link below. I provide a review of global stock market highlights over the past month and preview of the month ahead. Forward insights and perspectives are based on current financial market and economic trends with an emphasis on relevant developments in various areas from Fed policy to company earnings announcements.