

ERPE EXCERPTS
Bi-MONTHLY MARKET ANALYSIS &
ECONOMIC UPDATES
March 23, 2023
Containment or Contagion?
Bank Crisis 2023
Within 48 hours, Silicon Valley Bank, a nearly 40 year old bank with over $212 billion in total assets, failed. The rapid collapse was sparked by a panic induced run on the bank by large depositors Wednesday, March 9. That day, Silicon Valley Bank lost $42 billion in deposits, the largest bank run in U.S. history. By Friday the bank was seized by U.S. bank regulators and shut down. That bank failure sparked another bank failure over the ensuing weekend, then the bailout of 164 year old Credit Suisse bank by the Swiss government last week and now tremendous volatility and speculation over First Republic Bank and fears it could be the next one to fail. Call it a banking crisis. It has no doubt conjured up painful memories of the Great Financial Crisis (GFC) of 2007-2009. Since March 8, the government has taken swift action to help the banks and their depositors. The private sector has stepped up globally and made moves to shore up weakening regional banks. Just last week 11 large U.S. banks, including JP Morgan and Bank of America, pumped $30 billion in deposits into troubled First Republic Bank. I wonder what Mr. Warren Buffett is planning to do? As investors we need to ask: Is the crisis contained or will there be contagion?
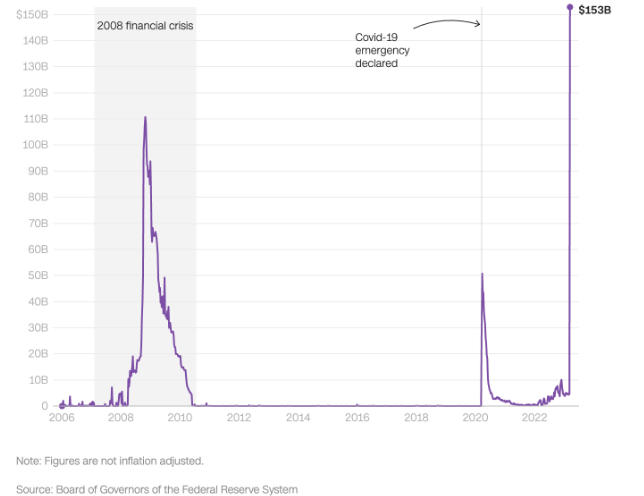
So far, the 2023 bank crisis looks to be contained an is not expected to spread throughout the entire U.S. banking system as occurred during the GFC. Coordinated action by the Federal Reserve and other leading central banks to keep dollars flowing around the financial system appears to have calmed nerves for now. At least on Tuesday, Treasury Secretary Janet Yellen said that regulators will maintain their commitment to rescue more depositors if necessary. While she seemingly back tracked on that comment yesterday, it is likely that the government will back-stop uninsured deposits (those exceeding the FDIC coverage of $250,000) from loss. The Federal Reserve is already acting aggressively as it lent more money to banks last week than in 2008 during the GFC, dishing out $153 billion. See graph below. On the global front, the European Central Bank’s President Christine Lagarde said Monday that regulations for smaller-sized banks had not been weakened in Europe. The ECB’s president said Tuesday that the capital and liquidity positions of European banks was “solid”.
My take is that the relatively small, poorly managed regional bank failures in recent weeks will not lead to a scenario similar to the 2007-2009 financial crisis. But the 2023 bank crisis is far from over and will not end without great debate, drama and controversy. One issue ripe for a feud is government intervention in the banking industry regarding uninsured deposits. It is estimated that there is now more than $1 trillion in uninsured deposits at U.S. banks. Should the FDIC coverage limits be raised to insure deposits in the millions of dollars, far exceeding the current $250k? If so, how will that get paid? What should also be anticipated from the 2023 bank crisis is investment opportunity and new and improved rules and tools to better govern the U.S banking industry.
TAKING PERSPECTIVE…
Proper Perspective: In our hectic and often hard to comprehend world, it is very easy to lose perspective. You may agree it is sometimes difficult to see the big picture. The media often doesn’t help with this, but unfortunately instead encourages us to see things in a most negative light. Here is hopefully a pause to gain positive perspective.

Famous Quote On This Day: “I know not what course others may take; but as for me, give me liberty or give me death!”
~ ~ Patrick Henry, 1775
What Happened On This Day, March 23, – 1775 – Patrick Henry delivers famous address.
MARKET ANALYSIS
INDICATORS OF INTEREST:
- Market’s Current Signal: Market in Confirmed Uptrend. Analysis of the stock market over 130 years of history shows we can view it in terms of three stages – market in uptrend, uptrend under pressure and market correction. I analogize this to a traffic signal’s changing colors from green to yellow and then to red. Since the 1880’s, this perspective has led to investment out-performance relative to market indexes. This is due to trend analysis which determines risk reducing, return enhancing market entry and exit points. The U.S. stock market’s current signal is Market in Confirmed Uptrend.
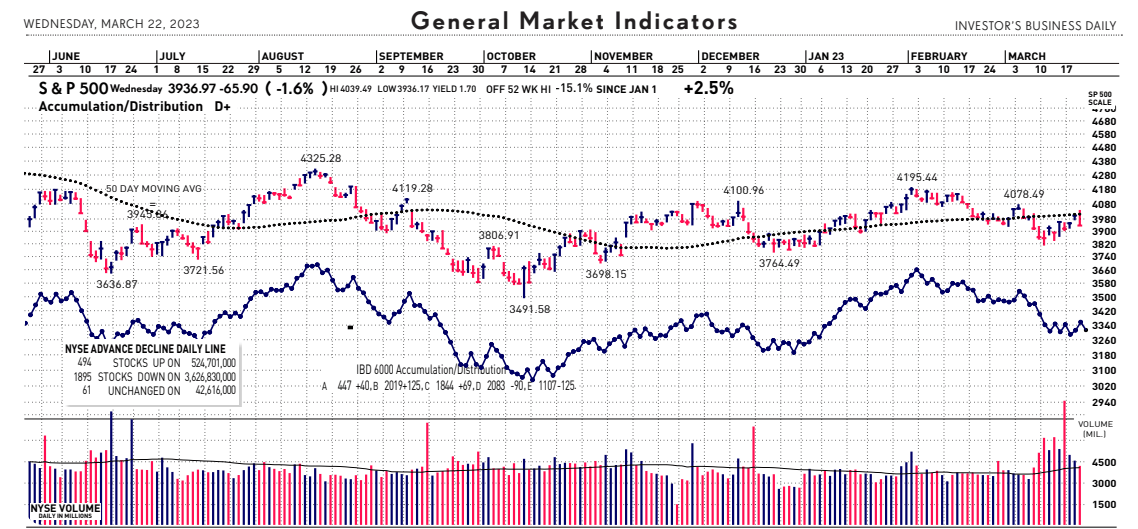
The Stock Market Trend: Market in Correction. The market’s current trend indicator weakened to Market in Correction March 15. It had flashed Under Pressure March 9. Fears, uncertainty and painful memories of the GFC has hit investor sentiment and taken below key support levels.
Here are key market levels as of Monday, March 20:
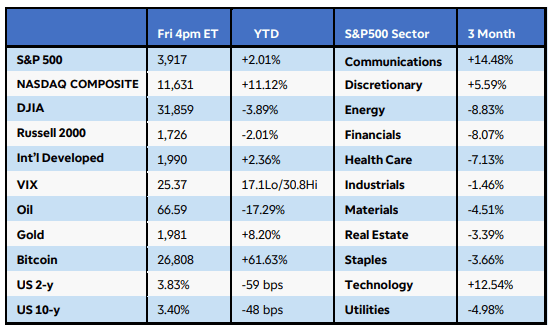
Recapping Last Week
U.S. equities finished mixed as unnerving interest rate volatility offset encouraging signs on the inflation front. The Nasdaq Composite jumped 4%, buoyed by a large drop in Treasury yields, while the S&P500 added nearly 1.5%. The Russell 2000 slid
2.5% as uncertainties remained in the financial sector. Seven of 11 S&P500 sectors gained ground, led by technology and communications, while financials slipped another 6%. Silicon Valley Bank declared bankruptcy, while First Republic Bank received a large capital injection from other large U.S. banks in an attempt to stay afloat. U.S. Treasury yields plunged, and the dollar surged midweek as investors flocked to risk-off assets. Crude oil tumbled 13%+ to below $70 per barrel on elevated recession fears, while gold continued its recent rally, climbing 6%. Bitcoin soared 32% as traders wagered that the Fed would pause rate hikes due to the liquidity crisis among regional banks.
Internationally, the European Central Bank lifted rates by 50bps and signaled it was
ready to supply liquidity to banks if needed. Credit Suisse shares were under pressure before receiving a lifeline from the Swiss National Bank. In China, retail sales for the first two months of the year matched estimates, but industrial production missed the mark as real estate investment sank 5.7% from a year ago.
Current View
Overall weakness and increased volatility in the broad market since March 9 triggered a more bearish market trend signal. On the 9th, the market’s trend weakened to Uptrend Under Pressure. Then, with compounding bank crisis concerns, the market’s trend signal fell into Market in Correction on the 15th. Yesterday’s market reaction speeches from both Fed Chairman Power and Treasury Secretary Yellen erased an attempted market rally. This morning, though, the market has rebounded strongly. What is a noteworthy stock market condition since the fall in banks is exceptional strength in mega-cap growth tech stocks. While bullish for those few leading stocks, this narrow breadth condition in less bullish for the overall market.
- Industry Group Strength: BEARISH. As of yesterday, 96 out the 197 groups I monitor are up year-to-date. 101 are down.
- New Highs vs. New Lows: BEARISH. In yesterday’s session, there were 65 new 52-week highs and 190 new 52-week lows.
- Dow Dividend Yield: BEARISH. The current yield for the Dow Jones Industrial Average is 2.32%. The 10-year Treasury now 3.46%.
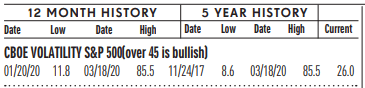
- Volatility Index: NEUTRAL. Volatility has been volatile. The “VIX” is now 21, the same as two weeks ago. The index is also known as the “Fear Index.” It is considered a contrarian indicator and therefore viewed as bullish as it rises indicating investors are becoming more fearful. The VIX:
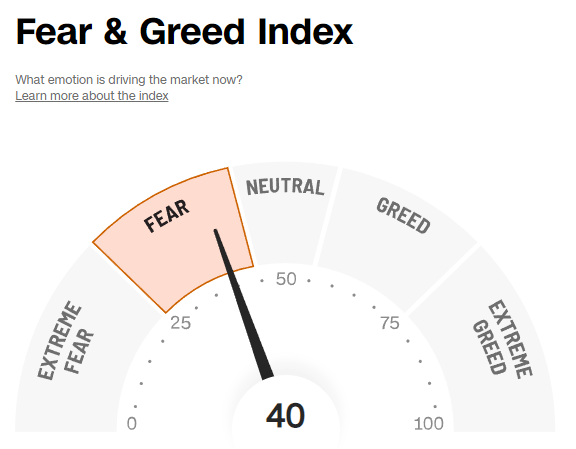
- Fear / Greed Index: BULLISH. Investors are driven by two emotions: fear and greed. Too much fear can create a condition of oversold/ undervalued stock prices. Too much greed can result in overbought/overvalued stock prices. The AAII Investor Sentiment Index is now neutral. BE FEARFUL WHEN OTHERS ARE GREEDY. At 40, the Fear & Greed Index is down from 60 two weeks ago.
- Bull / Bear Barometer: NEUTRAL. This secondary market indicator should also be viewed with a contrarian perspective. As of yesterday, according to the latest survey of stock market newsletter writers by Investor’s Intelligence, bullish sentiment is 39.7% and the bears came in at 28.8%. The bullish read is down from 2-weeks ago when it was about 44.4%. The bearish read is up from 26.4% 2 weeks ago. Consider this a contrarian indicator because the crowd is often wrong at market tops and bottoms. In other words, extreme bullishness has been seen near several market tops in the past, while extreme bearishness has been seen at market bottoms.
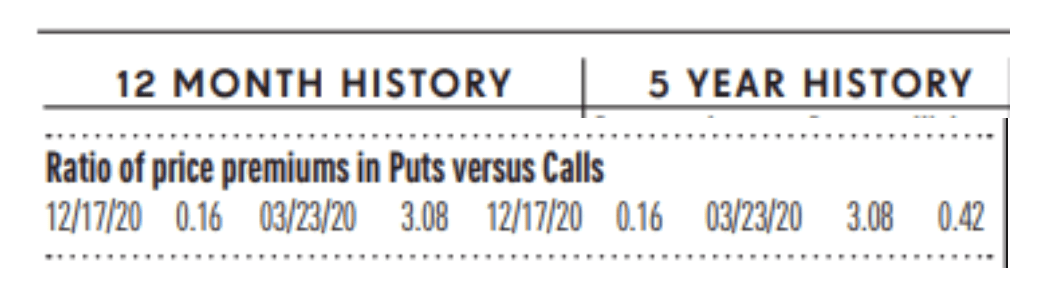
- Put / Call Ratio: NEUTRAL. The ratio of put-to-call options is .88, down from 1.02 two weeks ago. The put-call ratio tracks the mood of what options investors are doing, not just saying. They typically buy puts if they think a stock will decline and calls if they think it will rise. If they’re buying lots of puts, they see the market declining. And if they’re loading up on calls, they’re generally bullish. Historically, market bottoms occurred when the reading spikes to 1.2 or more. Market tops are often made when the reading is 0.6 or less. Note how reliable this is with respect to the February record low coinciding with the market high. Keep in mind this is also a contrarian indicator.
ECONOMIC UPDATES
Global Economic Indicators & Analysis:
POSITIVE INDICATORS
PPI Down: Signs of inflation retreating. U.S. wholesale prices fell 0.1% in February, the second decline in three months, and hinted at some easing in stubbornly high inflation. Economists polled by The Wall Street Journal had forecast a 0.3% increase in the producer price index. Wholesale costs often herald future inflation trends. In January, producer prices were also revised down to show a much smaller 0.3% increase instead of 0.7% as originally reported. The initial report had added to the perception that inflation was not likely to slow quickly. A separate measure of wholesale prices that strips out volatile food and energy costs rose a mild 0.2% last month, the government said last Wednesday. That was also below Wall Street’s forecast. The wholesale cost of goods fell last month, led by the third straight decline in food prices. That’s likely to lead some relief for consumers at the grocery store in the months ahead. The cost of services also declined for the second month in a row. Service inflation has risen sharply in the past year and is harder to reverse, making it a particularly big worry for the Federal Reserve. The PPI report captures what companies pay for supplies such as fuel, metals, packaging and so forth. These costs are often passed on to customers at the retail level and give an idea of whether inflation is rising or falling.
Import Prices Down: The cost of imported goods fell 0.1% in February and declined for the seventh time in the past eighth months, helping to contribute to a slowdown in U.S. inflation. Economists polled by the Wall Street Journal had estimated a 0.2% decrease. Over the past year, the cost of imports has fallen 1.1%, helped by a big reversal in the oil since last summer. That’s the first time import prices have shown a year-over-year decline since the end of 2020. As recently as a year ago, import prices were rising at a frothy 13% pace. The cost of imported fuel sank 5% last month to spearhead the decline in the headline number.
Existing Home Sales Up: U.S. existing-home sales jumped 14.5% to an annual rate of 4.58 million in February, the National Association of Realtors said Tuesday. The surge in sales reverses 12 months of losses in existing-home sales. The increase of 14.5% is the largest since July 2020, during the pandemic. Back then, sales rose by 22.4%. Single-family home sales in particular are at the highest ever since the NAR began tracking the number since 1999. Economists had expected existing-home sales to total 4.2 million in February. Compared with February 2021, home sales were still down by 22.6%. The median price for an existing home fell slightly to $363,000 in February. It’s the first drop in over a decade. There’s clearly a ton of pent-up demand in the housing market, as seen by February’s jump in home sales. A dip in mortgage rates may have propelled home buyers to jump on purchasing a home, boosting sales. But meeting supply is the biggest issue at the moment.
Jobless Claims Down: The number of Americans who applied for unemployment benefits last week slipped to a three-week low of 191,000, signaling little erosion in a strong U.S. labor market even as the economy faced fresh strains. New U.S. applications for benefits fell by 1,000 from 192,000 in the prior week, the government said today. The number of people applying for jobless benefits is one of the best barometers of whether the economy is getting better or worse. New unemployment applications remain near historically low levels. Economists polled by The Wall Street Journal had forecast new claims to total 198,000 in the last week.
WEAK INDICATORS
CPI Up – but Slowing: Consumer prices rose 0.4% in February and the annual rate of inflation slowed again. Economists polled by the Wall Street Journal had forecast a 0.4% advance in the consumer-price index last month. Prices had risen 0.5% in January, revised government figures showed. The annual rate of inflation, meanwhile, slowed to 6% from 6.4%. That’s the lowest level since September 2021. Yet the so-called core rate of inflation, which omits food and energy, rose a sharper 0.5%. Wall Street had forecast a 0.4% gain.
Consumer Confidence Down: A survey of consumer sentiment slid to 63.4 in March and fell for the first time in four months, reflecting angst among Americans about high inflation and the health of the economy. The preliminary reading in March was down from 67 in February, the University of Michigan said last Friday. Most of the survey was completed before the collapse of Silicon Valley Bank. Consumer sentiment helps gauge how Americans feel about their own finances as well as the broader economy. The index had fallen to a record low of 50 last summer before partly rebounding. Sentiment is still well below a recent peak of 88.3 in 2021, however, and a pre-pandemic high of 101.
Fed Hikes Rates Again: Yesterday the Federal Reserve raised interest rates again and signaled at least one more hike this year, but the failure of Silicon Valley Bank and the sudden crisis in other small regional banks also forced the central bank to adopt a more cautious strategy despite stubbornly high inflation. The Fed lifted its benchmark federal funds rate by a quarter of a percentage point to a nearly 16-year high of 4.75% to 5%. A year ago, that rate was close to zero. Fed Chairman Jerome Powell said in a press conference the central bank was planning to “continue with ongoing rate hikes” before the failure of Silicon Valley Bank. The bank’s collapse and ensuing stress in the financial system forced the Fed to consider a pause in interest-rate increases, Powell admitted. Still, the Fed left itself some wiggle room to raise interest rates as needed to tame high inflation. “Some additional policy firming may be appropriate,” they said.
An easy way to get my ERPE Excerpts is by “text-to-subscribe”. By simply texting to the number 22828 and entering the word erpe excerpts, a prompt is sent to enter an email address and done! You will then receive my bi-monthly market and economic updates. Please pass this on.
Call me if you have any questions. I am always happy to help!
John J. Gardner, CFP®, CPM®.
Blackhawk Wealth Advisors, Inc.
4125 Blackhawk Plaza Circle, Ste. 260 Danville, CA. 94506
Phone: 888-985-PLAN ·
Email: jg@blackhawkwealthadvisors.com
BLACKHAWKWEALTHADVISORS.COM
For my Market Monthly podcast, click on the link below. I provide a review of global stock market highlights over the past month and preview of the month ahead. Forward insights and perspectives are based on current financial market and economic trends with an emphasis on relevant developments in various areas from Fed policy to company earnings announcements.

